Join Our Telegram channel to stay up to date on breaking news coverage
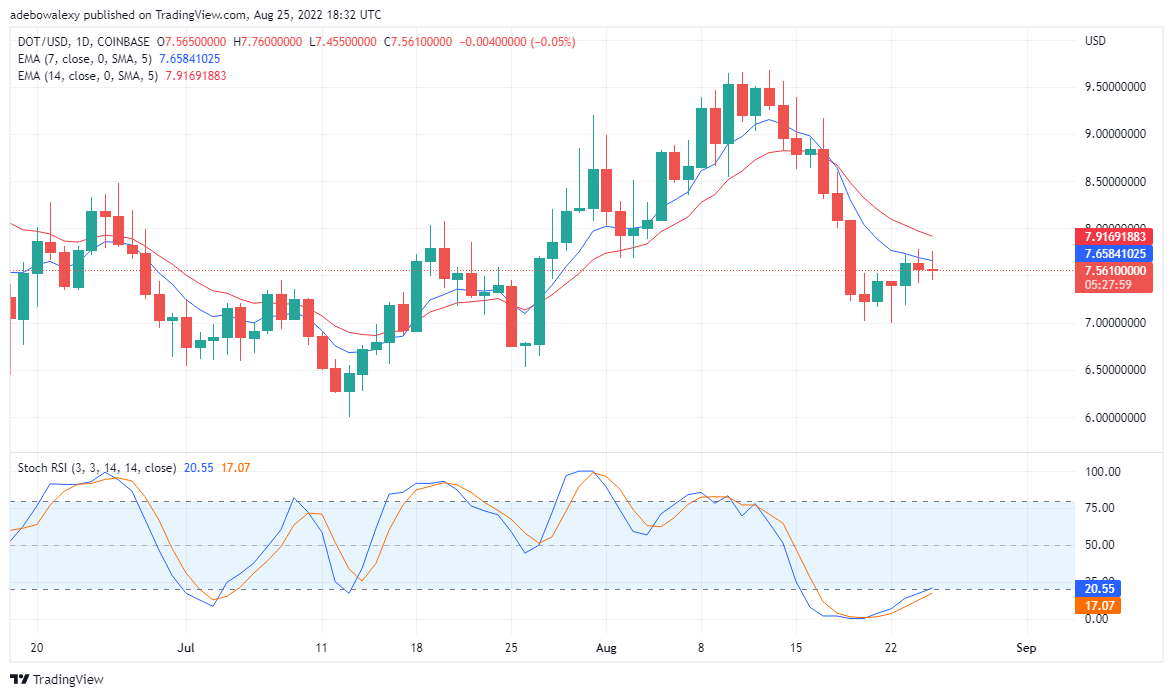
Polkadot rebounded upwards on getting to a strong support around $7.2350. But after moving a few steps to the upside, selling pressure resumed acting on the DOT/USD price action. Nevertheless, some trading indicators are still positive about a continuous uptrend.
DOT’s Analysis Statistics Data:
DOT’s Current Price: 7.5610
DOT’s Market Capitalization: $8.4 billion
DOT’s Moving Supply: 1.11 billion
DOT’s Overall Supply: 1.23 billion
DOT’s Coinmarketcap Ranking: #11
Important Price Marks:
Resistance Levels: $7.9169, $8.2000, $8.5000
Support Levels: $7.5610 $7.2000, $7.0000
In light of the activity of these trading indicators, we shall examine the DOT/USD and DOT/BTC market. We shall also deduce if these signs can be utilized in making trading decisions.
Polkadot Bulls Are Weak, Buy Tama Today
On the DOT/USD daily chart we can that the bears have started causing serious upset to price action. The last candlestick here is a bearish Doji, which portrays that the bears defeated the bulls in a tough battle in the Polkadot market. Consequently, this may be pointing out that buyers have yet again been overpowered. Furthermore, the EMA curves stay above price movement, and this portrays a continuation of a downtrend. Also, the RSI is pointing upwards, despite the formation of bearish candles on the trading chart. Consequently, the activities on the RSI may be pointing out that bulls are regrouping, and may soon take control of price movement. Therefore a buy order may be executed, should the price rise to $7.9169. This is because once price action reaches this level we may anticipate even more upside gain.
Polkadot Price Forecast: DOT/BTC in a State of Indecision
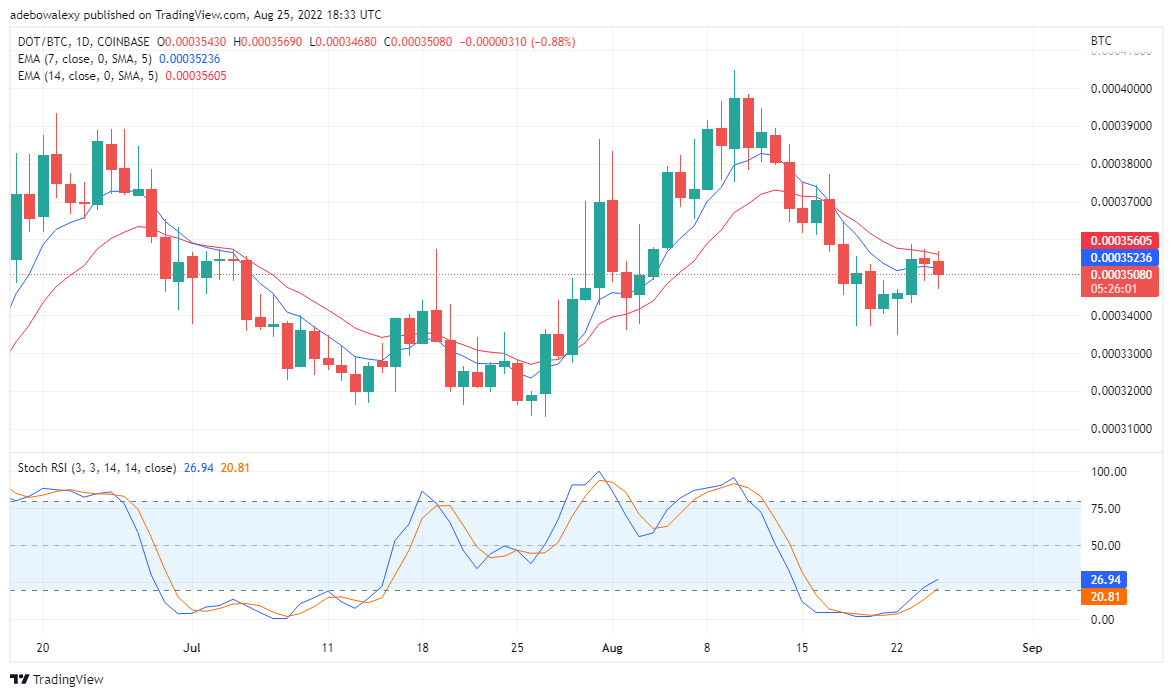
The Polkadot versus Bitcoin market is performing in almost the same manner as the DOT/USD market. That said, we can see that the bears remain in charge of this market as well, as value keeps falling lower. However, the EMA lines are now cutting across the price candles, and with increasing buying pressure value may soon cross above these lines.
Your capital is at risk.
Furthermore, the RSI indicator keeps rising towards the overbought area. As a result, this is pointing to the fact that buyers are increasing in strength, although bearish candles keep showing up on the price chart. Summing up the signs on this chart, traders may want to execute a buy order at the 0.0003600 value level.
To contribute to the Tamadoge fundraise, interested parties will need to connect with their crypto wallets, such as MetaMask or Trust Wallet, at buy.tamadoge.io. The TAMA token can be bought with USDT or ETH. Tamadoge runs on the Ethereum blockchain, the No.1 decentralised application computing platform.
Related
Join Our Telegram channel to stay up to date on breaking news coverage


