
Join Our Telegram channel to stay up to date on breaking news coverage
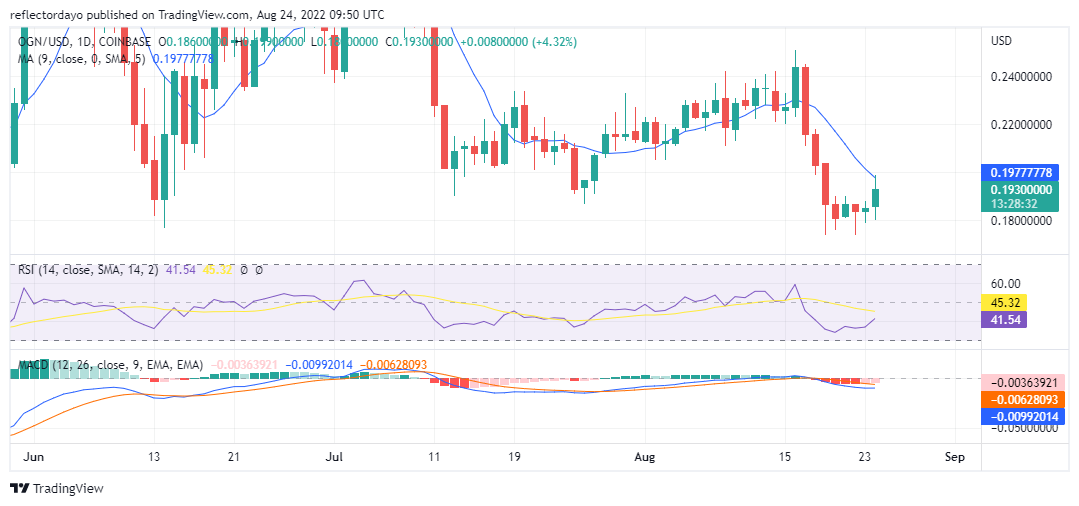
After the very strong OGN/USD bearish move between the 17th to 20th of August, the bulls began to show some signs of resistance towards regaining their ground in the market. Then on the 21st of August, bears could not go any further as bulls push the price up, but they later ended the day by closing the price at the previous day’s opening price. The bearish activities on the 22nd form resistance at $ 0.186752. on the 23rd and 24th, we can notice that there was a space between the two candlesticks that represents the two trading sessions. That signifies that the bulls are getting stronger.
Origin Protocol Price Statistic:
- OGN price now: $0.1916
- OGN market cap: $74,452,752
- OGN circulating supply: 388,570,733
- OGN total supply: 1,000,000,000
- OGN coin market ranking: #303
Key Levels
- Resistance: $0.20000, $0.210000, $0.220000
- Support: $0.18414548, $0.18199217 $0.18108551
Your capital is at risk
Origin Protocol Price Analysis: The Indicators Point of View
First, we should note the gap that is between yesterday’s candle and today’s candle. That is a sign of strong bullish resistance to regaining the market. The Relative Strength Index (RSI) shows that OGN/USD bull is trying to recover from the downside of the indicator. The RSI line is trying to catch up with the signal line. The RSI line is measuring 41.54% while the signal line measures 45.36%. we can see how close they are to each other. Once this happens, the market’s direction would be confirming that the trend has changed in favour of the bulls, but for now, the market can still be considered to be favouring the bears. In the MACD indicator, we can see that yesterday and today’s histograms are pink in colour. This reveals that the bulls are trying to come back.
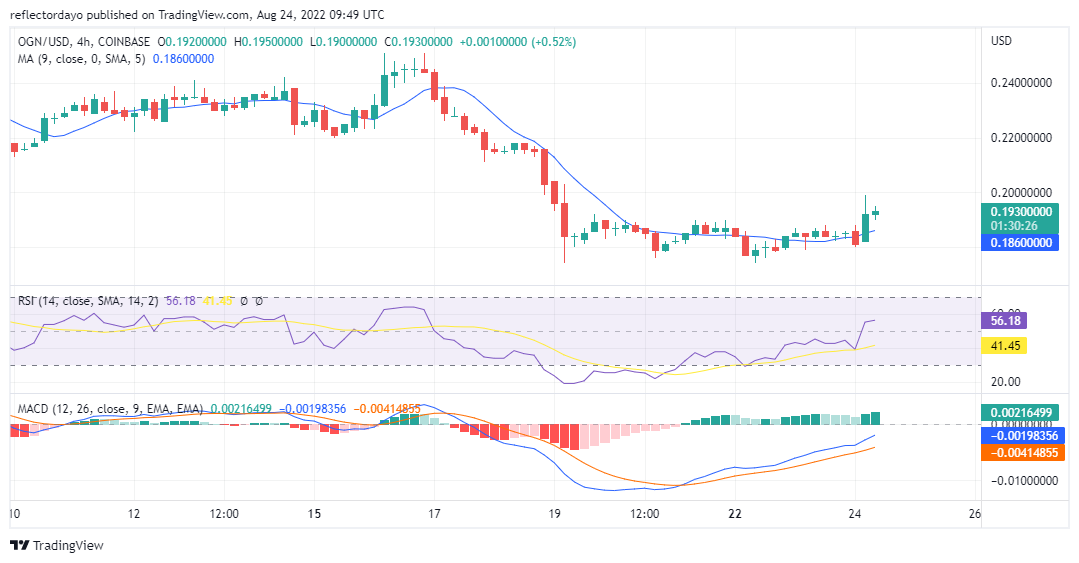
Origin Protocol Price Analysis: OGN/USD 4-Hour Chart Outlook
On the 4-hour chart, being a faster time frame, we can see that the price has already recovered from the downside. The bears have the first session today, but the bulls take the second session. The RSI line was quick to respond by shooting up to 55% after it touches the signal line in the lower section. It will be a struggle indeed for the bulls because the bears are also very active in today’s trading session
Related
Join Our Telegram channel to stay up to date on breaking news coverage