Join Our Telegram channel to stay up to date on breaking news coverage
Ontology Gas (ONT), a blockchain platform focusing on decentralized identity and data management, has surged 31% in the past 24 hours, with a trading volume of over $300 million. This remarkable, bullish price movement has made ONT among today’s top crypto gainers.
ONT is the native token of the Ontology platform, which facilitates and validates transactions, among other functions.
Additionally, some analysts, traders, and investors believe that ONT could reach $0.35.
However, it is essential to note that the crypto market is volatile, and prices fluctuate wildly.
The recent surge in ONT’s price could be attributed to several factors, including increased adoption of the Ontology platform and growing interest in decentralized identity solutions.
Ontology Gas ($ONT) Price Action
Ontology Gas has had a long and eventful history. It began trading on March 12, 2020, at $0.04242318 and has since increased in value by 1131.65% over the past 3 years.
In the first quarter of the year, the Ontology Gas ($ONT) price experienced high volatility in its price action, with occasional highs of $0.20 and lows of $0.18
The bulls maintained momentum, and the Ontology Gas price closed Q1, 2023, with its price above the $0.20 price mark, showing the bullish momentum present in the asset.
This price movement represents an increase of approximately 26.7% using its January 1, 2023 price mark of $0.187. Since the beginning of the second quarter of 2023, the price of ONT has been witnessing bullish sentiment, resulting in the price surging to $0.304 on April 17.
This significant price mark of $0.30 becomes the highest price level since the year started. In the last 7 days, the price of Ontology Gas ($ONT) has shown positive moves, trading between $0.1830 and $0.2133.
According to CoinMarketCap, over the last 30 days, Ontology Gas ($ONT) has seen a notable increase of 79.8%. The asset’s price is currently down by 98.1% from its all-time high price of $10.92, which occurred on May 3, 2018 (about 5 years ago).
Relatedly, the lowest price mark ONT has drooped to is at $0.1452, which represents an increase of 42.3% using its current price level. Based on technical indicators, the present market sentiment is optimistic (Bullish), while the Fear & Greed Index stands at 64 (Greed).
Ontology Gas has experienced 21 out of 30 (70%) positive trading days in the past month, with a price volatility of 8.50%. Considering the Ontology Gas market outlook, the current situation suggests a favorable moment to purchase Ontology Gas.
Bollinger Bands & RSI Signals Bullish Momentum
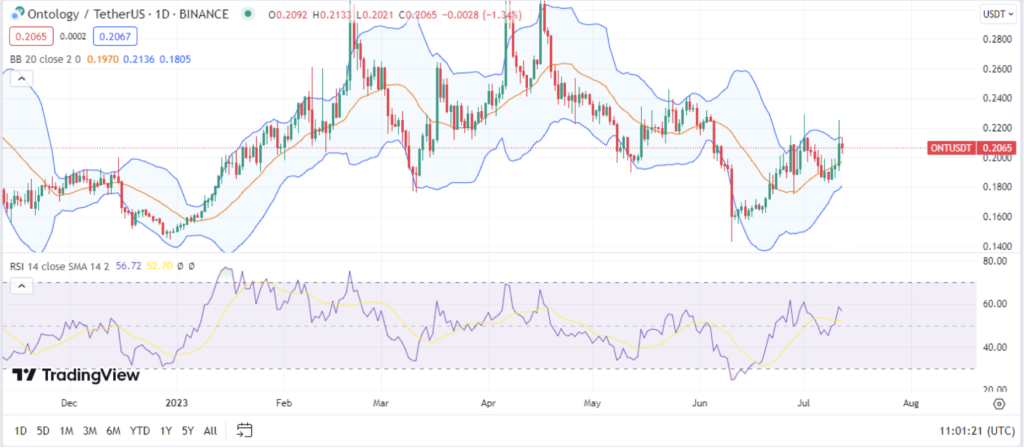
As illustrated on the daily chart above, Ontology Gas ($ONT) is trading above the middle band of the Bollinger Bands indicator, indicating that the asset’s price is higher than the average.
This suggests that the asset is upward or experiencing bullish momentum. Traders or investors may interpret this as a potential signal for further price appreciation or a buying opportunity.
Additionally, the Relative Strength Index Value of Ontology Gas ($ONT) is currently at 58.50 regions, suggesting a balanced price movement.
The RSI level above 50 also suggests that the bulls are building momentum to take control of the market.
Simple Moving Average & MACD Indicators
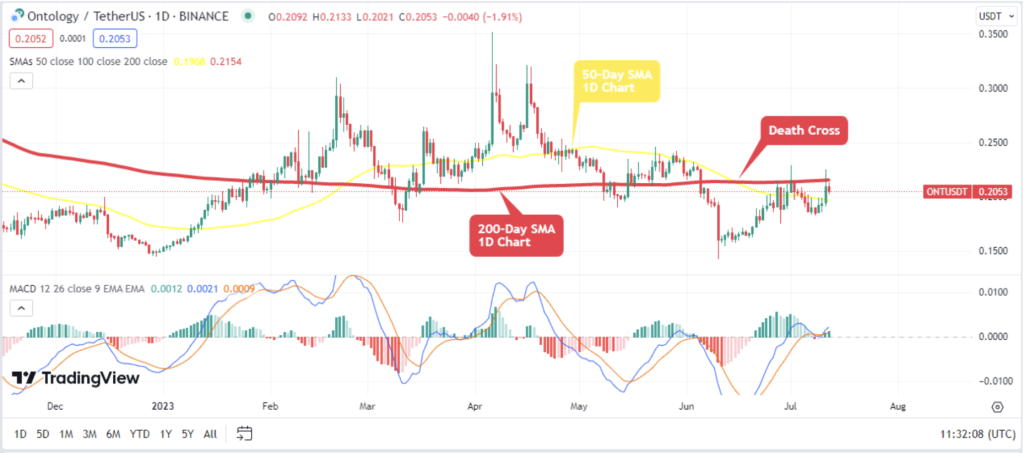
Both the Simple Moving Average and the MACD Indicator validate the bullish sentiment that is increasing in the market. Surprisingly, the asset recovered from the death cross formed on June 16, which was supposed to push down the price.
The asset is recovering, trading the 50-Day Simple Moving Average, and heading toward the 200-Day SMA. This highlights the massive bullish momentum currently in the Ontology Gas market.
Additionally, the Moving Average Convergence Divergence (MACD) of $ONT is above the signal line, suggesting bullish pressure. Also, the histogram bars showing green and above the zero level further confirms the bullish moves.
Traders and investors may interpret it as a long-term bullish run and a potential buy signal opportunity.
Technical Chart Pattern Shows Bullish Moves
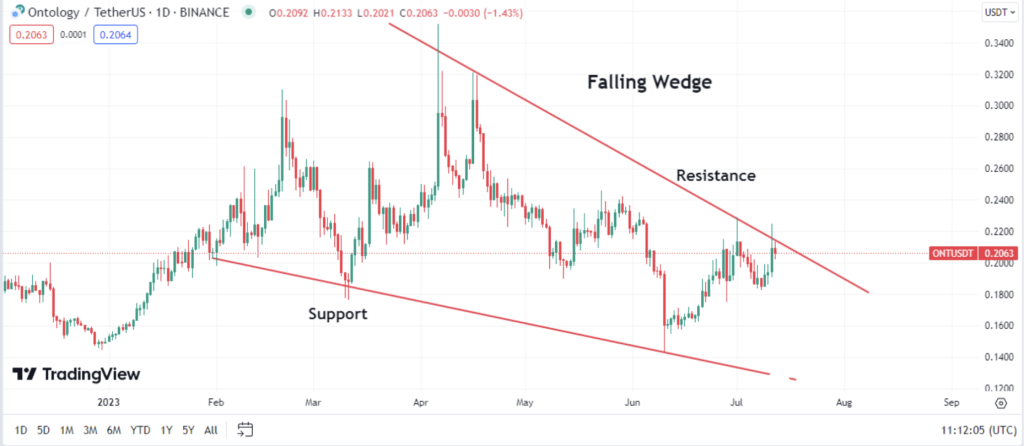
Based on the chart above, the Ontology Gas ($ONT) price has formed a falling wedge chart pattern, and the price is attempting to break the resistance level of the pattern; several potential outcomes could occur.
Firstly, if the price successfully breaks above the resistance level of the falling wedge, it could indicate a bullish reversal, sending the coin to a price mark of $0.35.
This breakout suggests that buying pressure is overcoming selling pressure, and traders may interpret it as a signal to enter long positions. The breakout could trigger a surge in buying activity, leading to a potential price rally.
However, considering other factors, such as volume and market conditions, is essential. The higher trading volume during the breakout strengthens the validity of the pattern and increases the likelihood of a sustained upward move.
On the other hand, if the price fails to break above the resistance level, it may result in a false breakout. This scenario could lead to a reversal or a continuation of the previous downtrend.
Factors Affecting the Price of Ontology Gas ($ONT)
Various factors can influence the price of Ontology Gas (ONT) coins. Here are two significant factors:
Market Demand and Adoption: The demand for ONT can heavily impact its price. Factors such as increasing adoption of Ontology’s blockchain platform, partnerships with other projects or companies, and integration into various decentralized applications (dApps) can drive demand for ONT.
As more individuals and enterprises utilize Ontology’s services and applications, the demand for ONT tokens may increase, potentially positively impacting its price.
Overall Cryptocurrency Market Trends: The broader trends in the cryptocurrency market can significantly affect the price of ONT.
Cryptocurrencies are interconnected, and market-wide factors like regulatory developments, investor sentiment, global economic conditions, and technological advancements can impact the entire market, including ONT.
For instance, during periods of heightened market optimism or bullish sentiment, investors may allocate more funds to cryptocurrencies, leading to an overall price increase for coins like ONT.
Conversely, negative market trends or widespread sell-offs may cause the price of ONT to decline, even if its specific fundamentals remain strong.
It’s important to note that the cryptocurrency market is highly volatile and influenced by many factors.
Therefore, comprehensive research and analysis of various elements are necessary to understand the potential price movements of ONT or any other cryptocurrency.
Potential Project, Wallet Street Memes, Set to Replicate Ontology Gas Performance
Wall Street Memes (WSM) is an innovative meme coin project that symbolizes the victory of everyday people in a capitalist society.
It embraces the radical concept that meme coins, which may appear insignificant, have the potential to generate substantial wealth for regular investors.
Remarkably, these meme coins have proven highly lucrative for investors throughout 2023, offering substantial rewards.
The world of cryptocurrencies is experiencing a notable increase in enthusiasm for meme coin ventures, resulting in the emergence of the $WSM token.
This token represents a community-driven strategy that empowers users to partake in meme trading and receive incentives.
Taking inspiration from Gordon Gekko’s memorable line “greed is good” from the 80s, investors in WSM possess optimistic expectations that their holdings will ultimately generate significant investment profits.
Amidst uncertain market conditions, investors are broadening their investment portfolios to capitalize on possible price increases, creating a conducive atmosphere for projects like WSM to attract notice.
Interestingly, the regulatory environment appears to support the rise of meme coins, although the utility of such projects remains a crucial factor to consider.
Best Wallet - Diversify Your Crypto Portfolio
Join Our Telegram channel to stay up to date on breaking news coverage


