Join Our Telegram channel to stay up to date on breaking news coverage
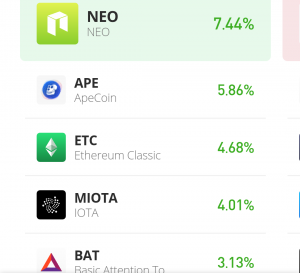
Of all the crypto today NEO/USDT has been able to record the most movement in its market. This crypto has moved a 7.44%, and this much movement has made it the most profitable of crypto today.
NEO price now: $10.56
NEO Market Cap: 751.4 million
NEO Total Supply: 100 million
NEO Rank: 61
Major Levels:
Resistance: $10.10, $10.30, $10.56
Support: $10.50, $10.20, $10.00
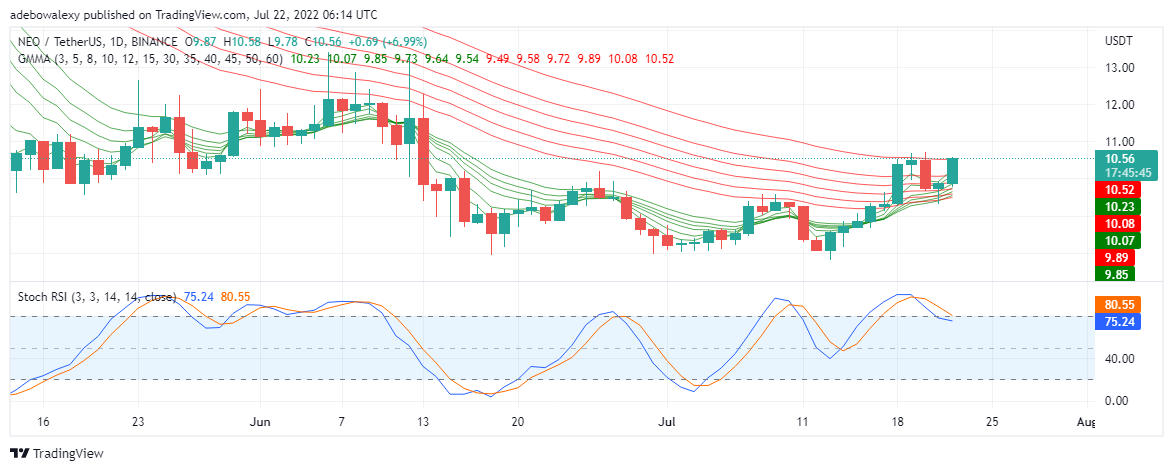
NEO/USDT Value Prediction: NEO Looks Promising
NEO/USDT daily chart reveals trading opportunities in this market. On the longer term of a day trading chart, activities portray further minimal price movement on the upside. Foretelling this is the GMMA: Guppy Multiple Moving, in which most of its lines are cutting across each other. This activity foretells that the NEO value will experience some more push to the upside.
Furthermore, the RSI: Relative Strength Indicator, seems plunging downwards but already making a U-turn while still in the overbought zone. Consequently, the behavior of this tells that more upward movement should be expected in this market. Therefore, traders can expect that prices may still reach $11 and $12.40 levels.
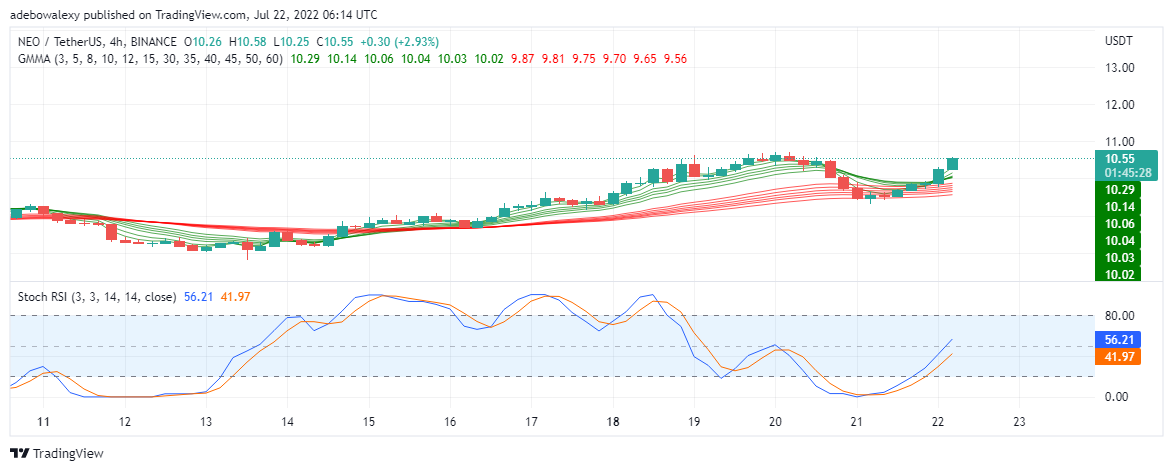
NEO/USDT Value Prediction: NEO Optimism with a Pinch of Doubt
The NEO/USDT 4-hour chart still shows some promise, however, with an indication of doubt. Here we can see the GMMAs brushing against each other, and bouncing off in opposite directions. Although these lines remain under the price motion, if the faster line should pass above the price motion, the NEO value may range.
Nevertheless, the bright side is revealed on the RSI indicator. Here we can view the curves of this indicator steadily rising upwards. Also, these lines haven’t reached very high: around 56% and 42%, which implies that more room remains for the price to increase.
Join Our Telegram channel to stay up to date on breaking news coverage