Join Our Telegram channel to stay up to date on breaking news coverage
NEO Price Analysis – August 17
NEO experienced a heavy fall in the price from the beginning of the week. The coin fell tremendously and wasn’t showing any sign of recovery.
NEO/USD Market
Key Levels:
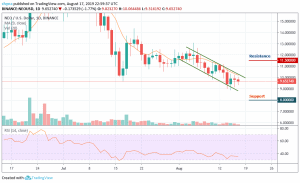
Resistance levels: $11.5, $12.0, $12.5
Support levels: $8.0, $7.5, $7.0
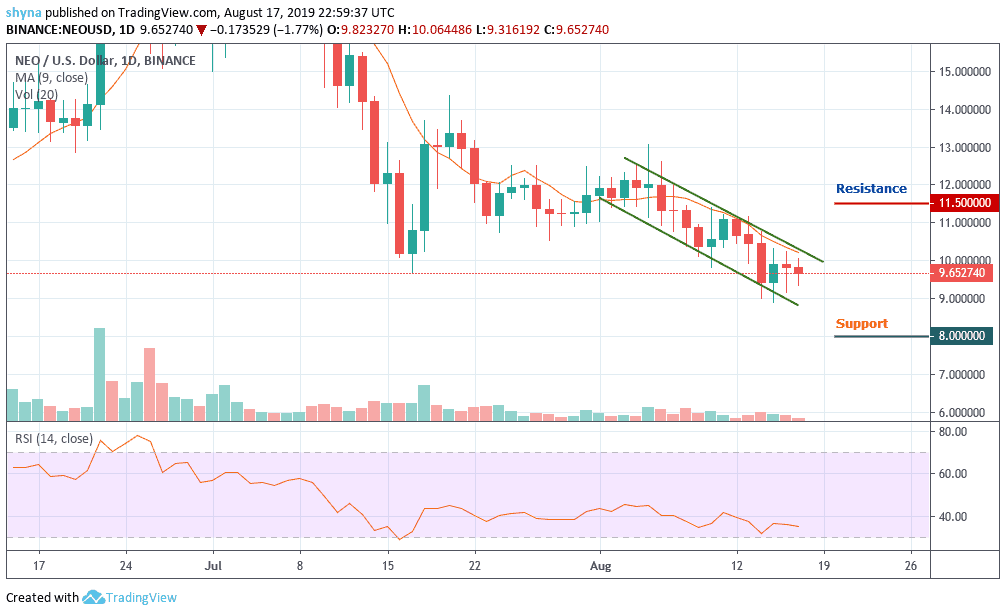
Today, NEO has resumed back in the middle of consolidation after a slight drop from near the $9.8. The price is now roaming around the $9.65 level. If the market continues the surge and squeeze, the, $9.8 is likely to surface in the next few positive moves. More so, the NEO/USD pair might further look for higher price levels if the bulls continue to show commitment.
However, the market is currently displaying a sign of subduing volatility with choppy price action. Taking a look at the price chart, we can see the trading volume is still low. If the NEO/USD pair continues to stay under the control of bears, the price may roll back to previous supports at $8.0, $7.5 and $7.0 levels. On the upside, we can expect the next level of resistance at $11.5, $12.0 and $12.5. The RSI (14) is still moving under level 40.
NEO/BTC Market
Comparing with Bitcoin, NEO performance has been very low due to a recurring bearish sentiment which has caused the market to fall drastically. In other words, the price actions remain choppy, trading side-way since August 11. The market is indecisive but the traders have to be on the watch for the possible next NEO’s direction.
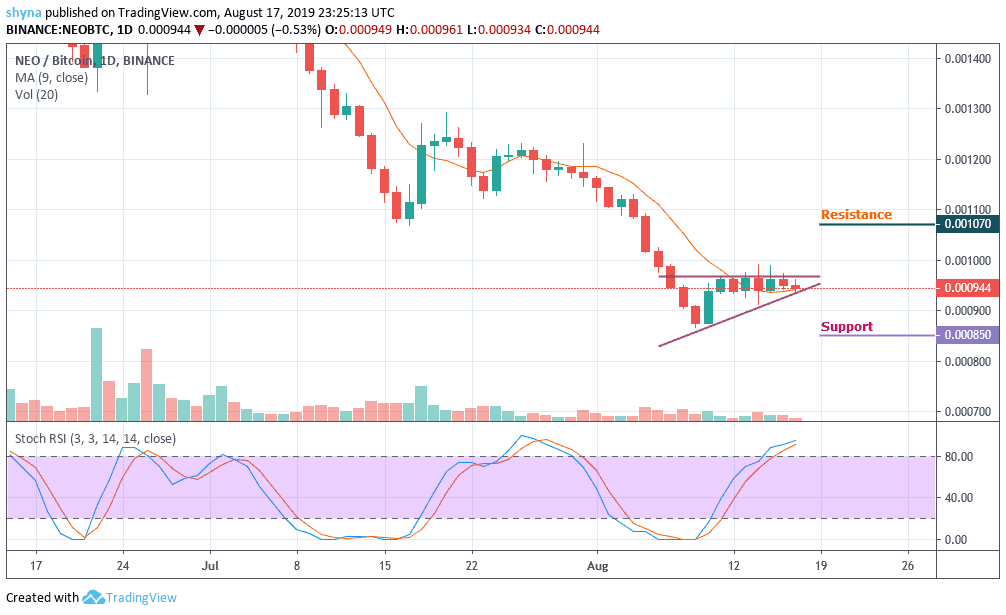
For a positive upsurge, the 1070SAT and 1100SAT are the major resistance levels for the coin for now. Looking at the current movement of the market, it is revealed NEO at its lowest. Therefore, a negative spike could retest the important support at the 850SAT and 800SAT before a possible slip to 750SAT. The Stochastic RSI has reached the highest condition. We can expect selling pressure when the indicator turns downward.
Please note: insidebitcoins.com is not a financial advisor. Do your research before investing your funds in any financial asset or presented product or event. We are not responsible for your investing results.
Join Our Telegram channel to stay up to date on breaking news coverage