Join Our Telegram channel to stay up to date on breaking news coverage
XMR Price Analysis – July 4
Monero and a few other coins are the only digital recording gains today. XMR has appreciated over 2% on the day as crypto languishes in selling pressure and unable to break stubborn supply levels.
XMR/USD Market
Key Levels:
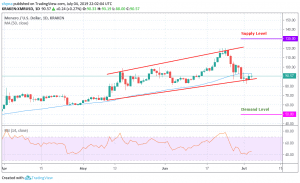
Supply levels: $130, $140, $150
Demand levels: $50 $40, $30
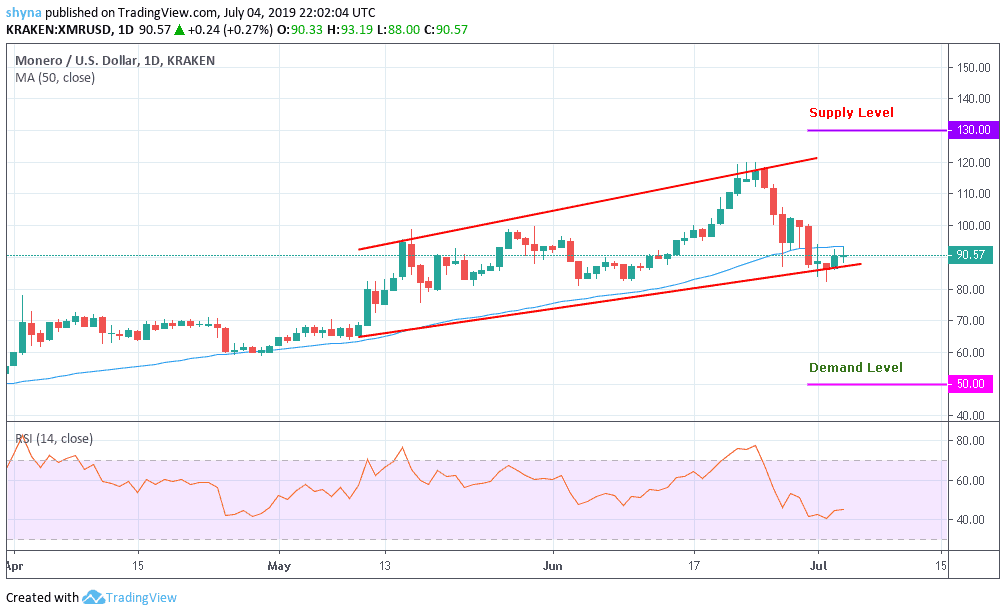
Monero like most of them cryptocurrencies succumbed to selling pressure this week. XMR/USD plunged massive from highs above $118 to support at $86. There was a struggle for recovery on Wednesday; the price stepped below the blue-line 50-day Moving Average in addition to the Relative Strength Index (RSI) holding position above 40. Further correction north stepped above $90 but losses fell short of $100 at $91.
At press time, XMR/USD is exchanging hands at $90.57. As the momentum’s steam cools off at this level, reaction to a double-top pattern is expected. The retracement could retest $90 before confirming the reversal towards $100. Moreover, technical analysis suggests sideways trading as the next course of direction for the price. The supply levels to watch out for are $130, $140 and $150 while the demand levels are $50, $40 and $30 respectively.
XMR/BTC Market
Since the beginning of this month and after a slight decline in XMR/BTC a few days ago, the daily chart shows that the XMR has managed to exit the bearish trend line today, but the price is currently moving from 0.0075BTC to 0.0077BTC. The market price has not yet reached the 50-day MA blue-line but it’s trying to move in an uptrend direction, buyers are likely ready to take over.
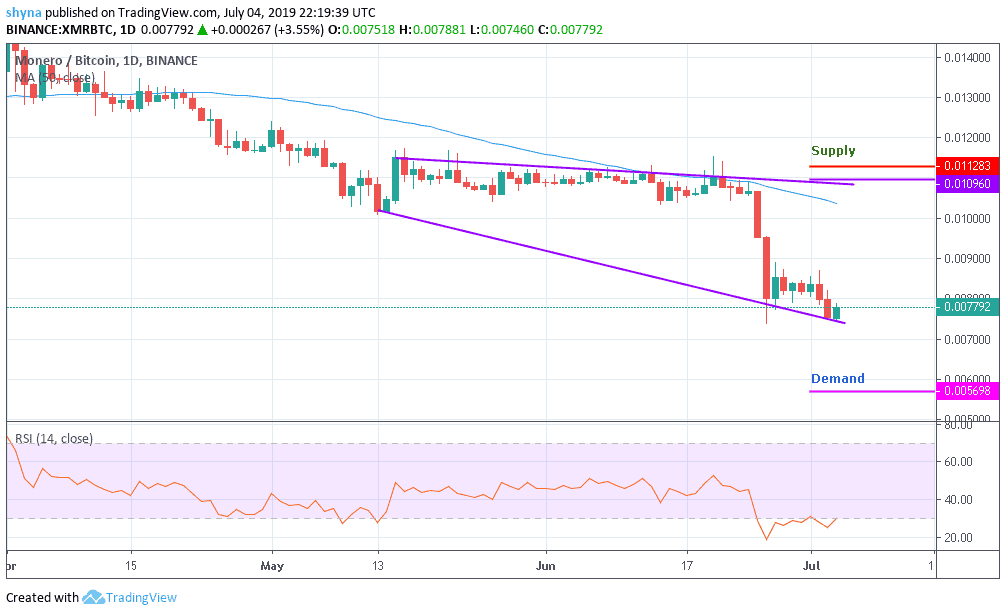
The RSI on the daily chart shows that the market could continue moving sideways for some time before taking its uptrend to probably reach the level of supply at 0.011BTC. Once the pattern of the channel breaks, the upward trend may likely resume, otherwise, sellers should prepare for a slight decrease.
Please note: insidebitcoins.com is not a financial advisor. Do your own research before investing your funds in any financial asset or presented product or event. We are not responsible for your investing results.
Join Our Telegram channel to stay up to date on breaking news coverage