Join Our Telegram channel to stay up to date on breaking news coverage
Lucky Block: August 17th
Today LBLOCK/USD appears to have commenced an upward correction. This has consequently brought the value of the crypto to around $0.002082. And, at that, Lucky Block is still at the beginning of a lucrative trading opportunity, as the price may go even higher soon. Therefore, buyers should utilize the trading opportunity by buying into the market promptly.
Current Value of LBLOCK’S: $0.002082
LBLOCK Market Cap: $7.4 million
LBLOCK Systemic Supply: ——
LBLOCK Overall Supply: 3.6 billion
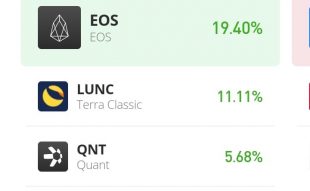
LBLOCK Coinmarketcap Position: #3184
Important Price Marks:
Resistance: $0.002082, $0.002100, $0.002150
Support: $0.002110, $0.002105, $0.002080
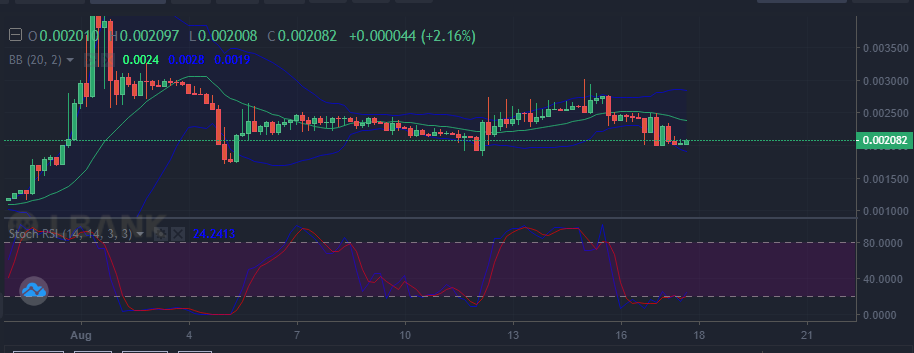
Lucky Blocks Price Analysis: LBLOCK/USD Is Preparing a Massive Upside Correction
LBLOCK/USD 4-hour chart is showing signs of a huge Upside value retracement. From the last few candles on this chart, evidence of possibly breaking higher resistance abounds. Already, the lower band of the Bollinger band has been tested and value activity is being rejected toward the center line of the indicator. Additionally, the last candle here is an inverted Marubozo, which indicates that the bulls are up and running in the market. Consequently, this guarantees the possibility of additional upside gain from here. Furthermore, the Stochastic RSI indicator curves have taken off from the oversold area. Also, it has made an upside cross, which tells that Lucky Block price will keep rising. Traders can enter the market with a buy stop, placing targets around $0.002300 and above.
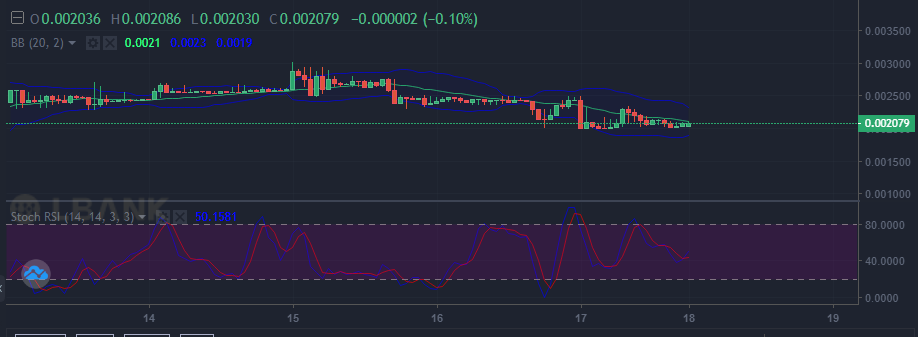
Lucky Blocks Price Analysis: LBLOCK/USD Upward Bounce Progress
On the hourly chart, LBLOCK/USD has the aforementioned correction has progressed significantly. Furthermore, the latest price candles are still bullish and are now almost crossing the center line of the Bollinger indicator to the upside. Once Lucky Block’s price action can cross above the center line of this indicator, higher value levels will subsequently be tested and broken. In addition, the SRSI on both charts keeps pointing to the fact that the uptrend is gathering momentum. Therefore, traders should catch in on this trend early enough.
You can purchase Lucky Block here. Buy LBlock
Related
Join Our Telegram channel to stay up to date on breaking news coverage