Join Our Telegram channel to stay up to date on breaking news coverage
Lucky Block Price Prediction – August 22
LBLOCK has continued its downward correction as bulls recover to resume uptrend. The implication is that the cryptocurrency will be compelled to a range-bound move for a few days. Also, the altcoin will trend when the moving average lines are breached.
LBLOCK Price Statistics Data
LBLOCK price now – $0.00045
LBLOCK market cap – $18,351,775
LBLOCK circulating supply – 40.77B LBLOCK
LBLOCK Total Supply -$45,002,710
LBLOCK Coinmarketcap ranking – #3374
Key Levels:
Resistance levels: $0.0016, $0.0018, $0.0020
Support levels: $0.0009600, $0.0009400, $0.0009200
LBLOCK/USD Medium-term Trend: Bearish (1-hour chart)
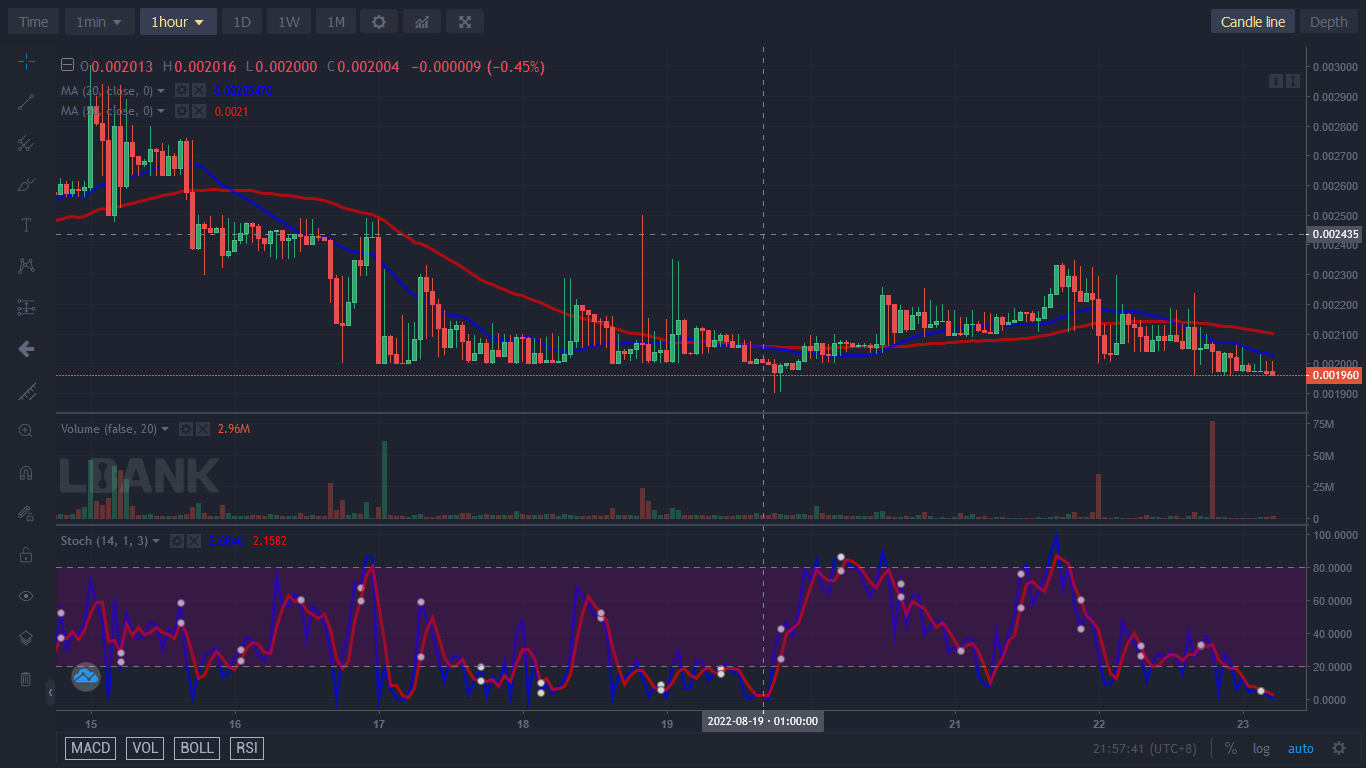
Since August 16, LBLOCK has been in a sideways trend. The cryptocurrency has been trading between $0.002000 and $0.002200 price levels. On August 21, the bears break below the moving average lines to reach the low of $0. 001961. The selling pressure could have accelerated as price breaks below the moving average lines. However, the altcoin has fallen to the oversold region of the market. Further selling pressure is unlikely. Buyers are expected to emerge in the oversold region to push price upward. The altcoin has fallen below the 20% range of the daily Stochastic.
LBLOCK/USD Medium-term Trend: Bearish (15-Minute Chart)
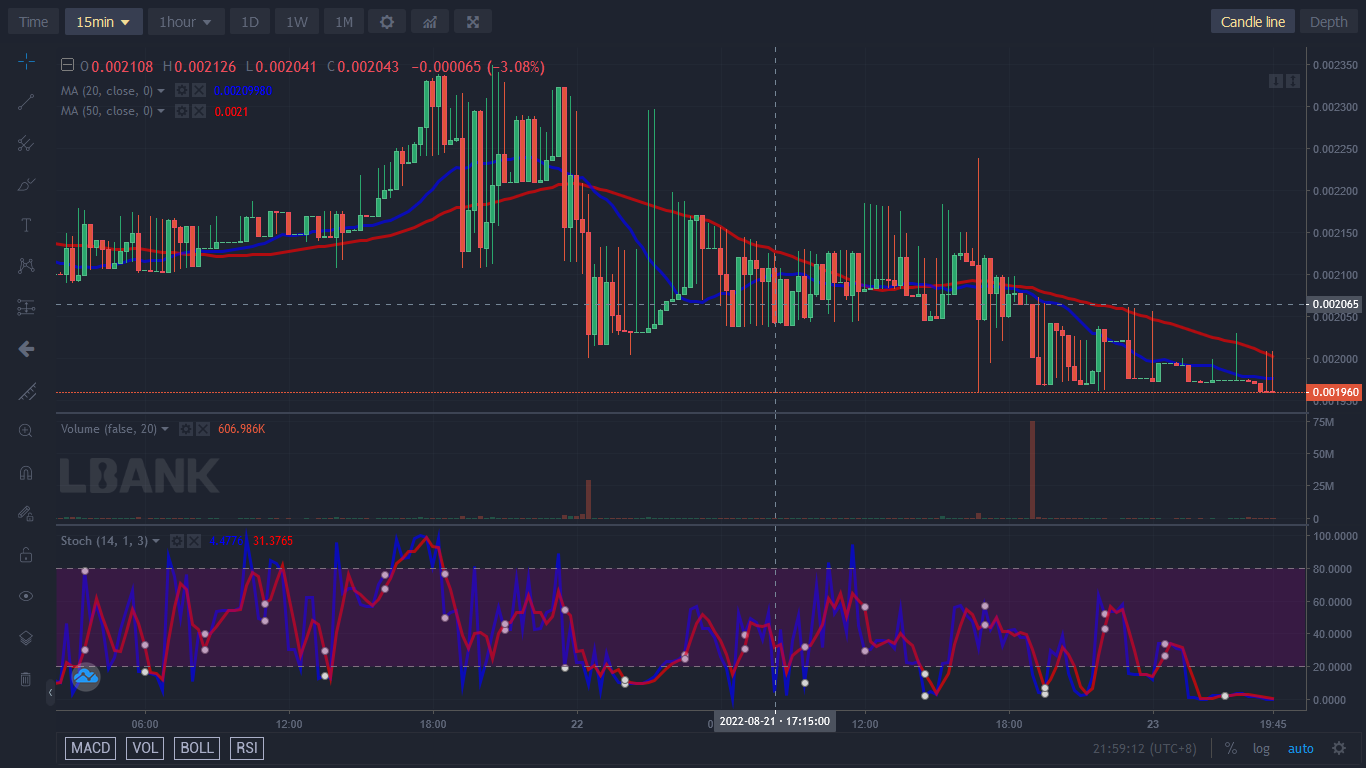
On the 15 – Min Chart, the altcoin is in a sideways move as bulls recover to resume uptrend. The price action is dominated by small body indecisive candlesticks called Doji and Spinning tops. Buyers and sellers are undecided about the direction of the market. As the market is oversold selling pressure will reach bearish exhaustion.

Related:
• How to buy Tamagoge
• Visit Tamadoge Website
Join Our Telegram channel to stay up to date on breaking news coverage


