Join Our Telegram channel to stay up to date on breaking news coverage
Lucky Block Price Prediction – August 13
LBLOCK is still in a downward correction as it is set for a fresh uptrend. Buyers are likely to be attracted in the oversold region to push prices upward.
LBLOCK Price Statistics Data
LBLOCK price now – $0.001244
LBLOCK market cap – $50,719,233
LBLOCK circulating supply – 40.77B LBLOCK
LBLOCK Total Supply – $124,128,827
LBLOCK Coinmarketcap ranking – #3374
Key Levels:
Resistance levels: $0.0016, $0.0018, $0.0020
Support levels: $0.0009600, $0.0009400, $0.0009200
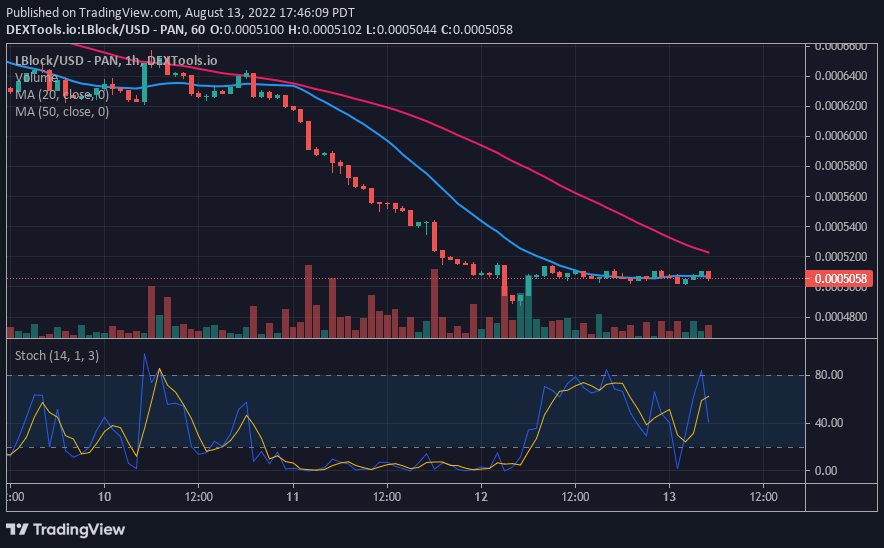
LBLOCK/USD Medium-term Trend: Bearish (1-hour chart)
After the price slump on August 12, LBLOCK rebounded as price broke above the 21-day line SMA. Buyers fail to extend the bullish momentum to breach the 50-day line SMA. The cryptocurrency is now trading between the moving average lines. The selling pressure will resume if price breaks below the 21-day line SMA. On the other hand, if the bulls breached the 50-day line SMA, it will signal the resumption of the uptrend. Meanwhile, the altcoin is below the 20% range of the daily Stochastic. It indicates that buyers are expected to emerge in the oversold region of the market.
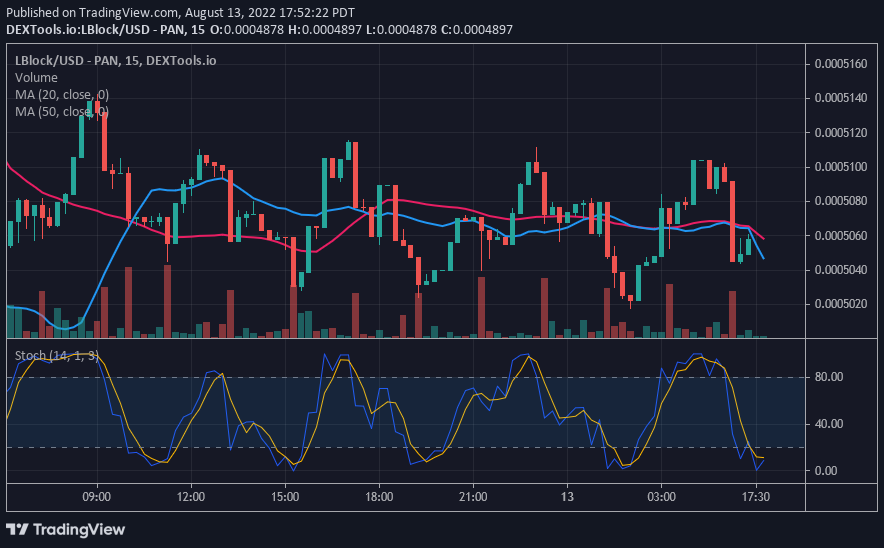
LBLOCK/USD Medium-term Trend: Bearish (15-Minute Chart)
On the 15 – Min Chart, the altcoin is in a range-bound move as it is set for a fresh uptrend. The crypto price is fluctuating below and above the moving average lines. The uptrend will resume if the price bars are above the moving average lines and the bullish momentum is sustained. Today, LBlockUSD is resuming upward as price breaks above the moving average lines.

You can purchase Lucky Block here. Buy LBLOCK
Related:
Join Our Telegram channel to stay up to date on breaking news coverage


