Join Our Telegram channel to stay up to date on breaking news coverage
Lucky Block Price Prediction – July 22
Today, LBLOCK has rebounded the current support as bulls overrun bears. The cryptocurrency is approaching the high of $0.001137. With the recent price rebound, the altcoin will be out of a downward correction if the bullish momentum is sustained.
LBLOCK Price Statistics Data
LBLOCK price now – $0.001109
LBLOCK market cap – $44,892,059
LBLOCK circulating supply – 40.77B LBLOCK
LBLOCK total Supply – $110,870,241
LBLOCK Coinmarketcap ranking – #3374
Key Levels:
Resistance levels: $0.0016, $0.0018, $0.0020
Support levels: $0.0009600, $0.0009400, $0.0009200
LBLOCK/USD Medium-term Trend: Bearish (1-hour chart)
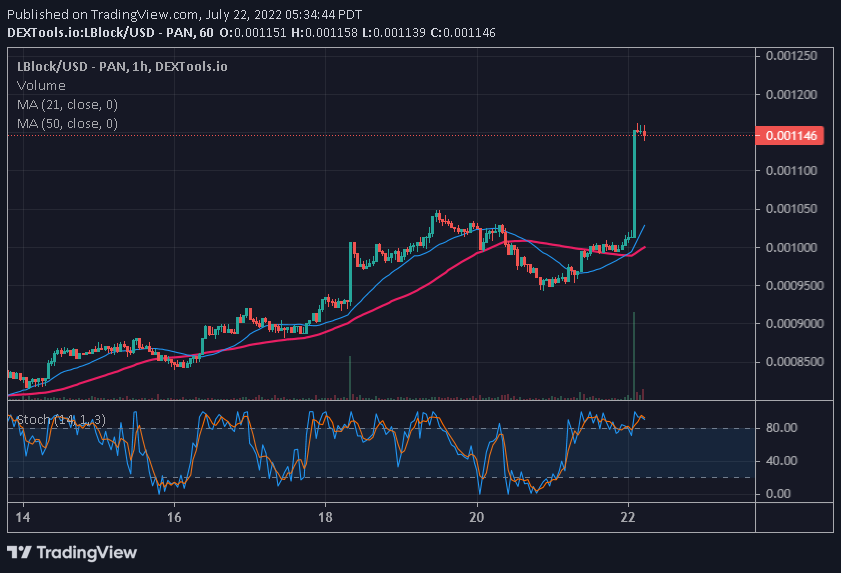
Before the recent rebound, LBLOCK has been consolidating above $0.0009360 since June 13. On July 12, the bulls bought the dips as the altcoin resumed its upward move. The bulls broke the 21-day line SMA but failed to break the 50-day line SMA. The crypto was in a sideways move for three days between the moving average lines before the breakout. On July 22, the altcoin rebounded above level $0.001019 to reach the high of $0.001150. The price rebound breached the resistance at $0.001100. The cryptocurrency is experiencing a minor retracement. The uptrend will resume if the LBLOCK finds support above $0.001100. On the upside, the next target price will be the high of $0.1400, if the uptrend resumes.
LBLOCK/USD Medium-term Trend: Bearish (15-Minute Chart)
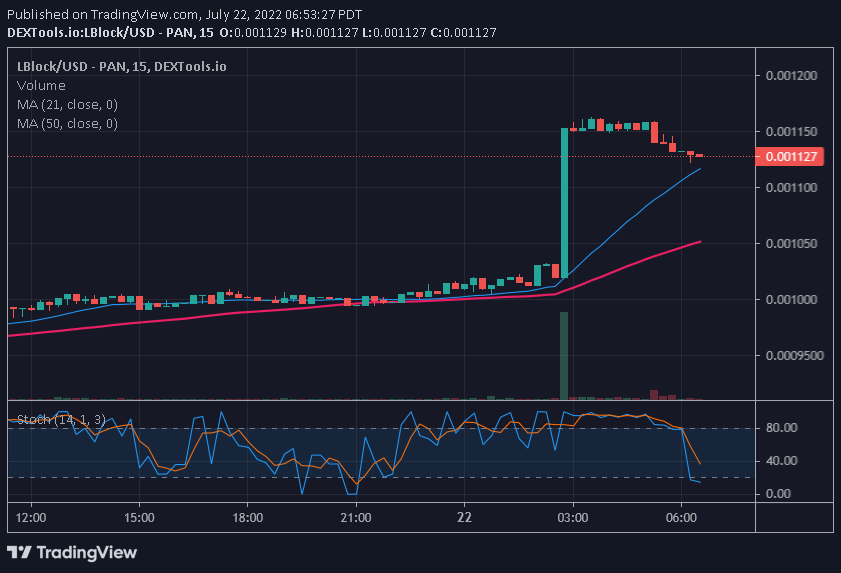
On the 15 – Minute Chart, the altcoin has rebounded and retraced to the 21-day line SMA as bulls overrun bears. On the downside, if the altcoin retraces and finds support above the 21-day line SMA, the altcoin will resume a fresh uptrend. In the same vein, the crypto has fallen to the oversold region of the market. Buyers are likely to be attracted to the oversold region to push prices upward.

Join Our Telegram channel to stay up to date on breaking news coverage


