


Join Our Telegram channel to stay up to date on breaking news coverage
Lucky Block Price Prediction – July 8
LBlock is in a downward correction as it targets the $0.001000 high. Since June 23, the price movement has been stable as the altcoin consolidates below the moving average lines for a price rebound. The 21-day line SMA is the resistance line to the price bars. The crypto’s price will attempt a price rebound after consolidating below the resistance level after a while. LBlock/USD is trading at $0.0009280 at the time of writing.
LBLOCK Price Statistics Data
LBLOCK price now – $0.0009566
LBLOCK market cap – $38,774,158
LBLOCK circulating supply – 40.77B LBLOCK
LBLOCK total Supply – $95,663,601
LBLOCK Coinmarketcap ranking – #3569
Key Levels:
Resistance levels: $0.0016, $0.0018, $0.0020
Support levels: $0.0009600, $0.0009400, $0.0009200
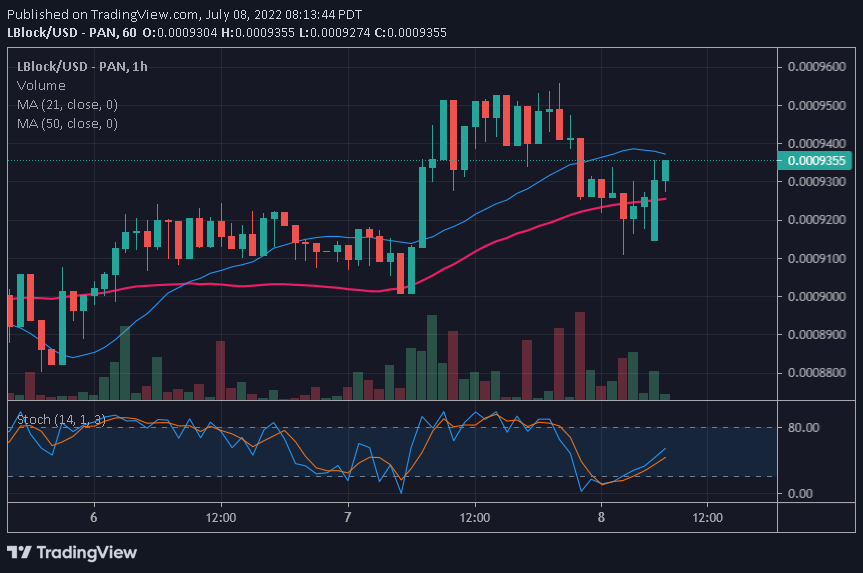
LBLOCK/USD Medium-term Trend: Bearish (1-hour chart) – It Targets the $0.001000 High
The cryptocurrency has regained bullish momentum as price breaks above the 50-day line SMA. The price surge is approaching the 21-day line SMA. A break above the 21-day line SMA will signal the resumption of upside momentum. Firstly, the altcoin will revisit the previous high of $0.0009500 to break above it. A break above the $0.0009500 will catapult LBlock to the high of level $0.001000. Meanwhile, the altcoin is above the 40% range of the daily stochastic. It indicates that the coin is in a bullish momentum.
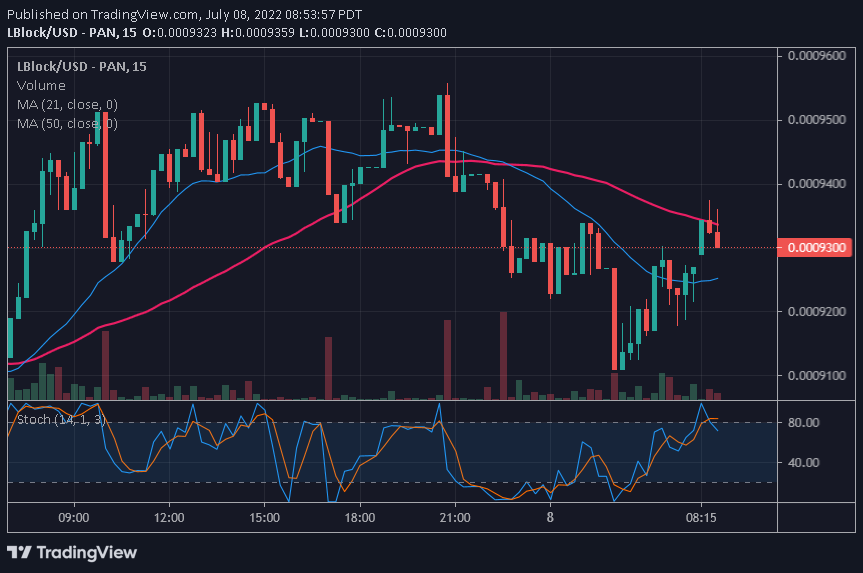
LBLOCK/USD Medium-term Trend: Bearish (15-Minute Chart)
In the lower time frame, LBlock price is trading between the moving average lines as it targets the $0.001000 high. The altcoin will trend when the moving average lines are breached. For instance, a break above the 50-day line SMA will propel the cryptocurrency to reach the high of $0.0009500. Further upward moves are possible above the moving average lines. The coin is above the 60% range of the daily stochastic. Also, It indicates that the market is in a bullish momentum.
Join Our Telegram channel to stay up to date on breaking news coverage
