Join Our Telegram channel to stay up to date on breaking news coverage
Lucky Block has little price action (PA) to perform technical analysis (TA) on as it is such a new asset, launching on Pancakeswap on Jan 26th 2022.
About to close its fifth day of trading, the crypto lottery token LBLOCK is currently up over 1000% on the exchange having started trading at around $0.00020 and currently priced at $0.0021.
Those who bought Lucky Block during the first round of the presale at $0.00015 or second round at $0.00019 have seen a return on investment (ROI) of over 10x.
Many investors ask ‘what is the next 10x altcoin’ when looking for the most promising cryptocurrency to buy – LBLOCK met that target within days of launch, making it one of the best new cryptos to buy in 2022 so far.
LBLOCK Price Prediction
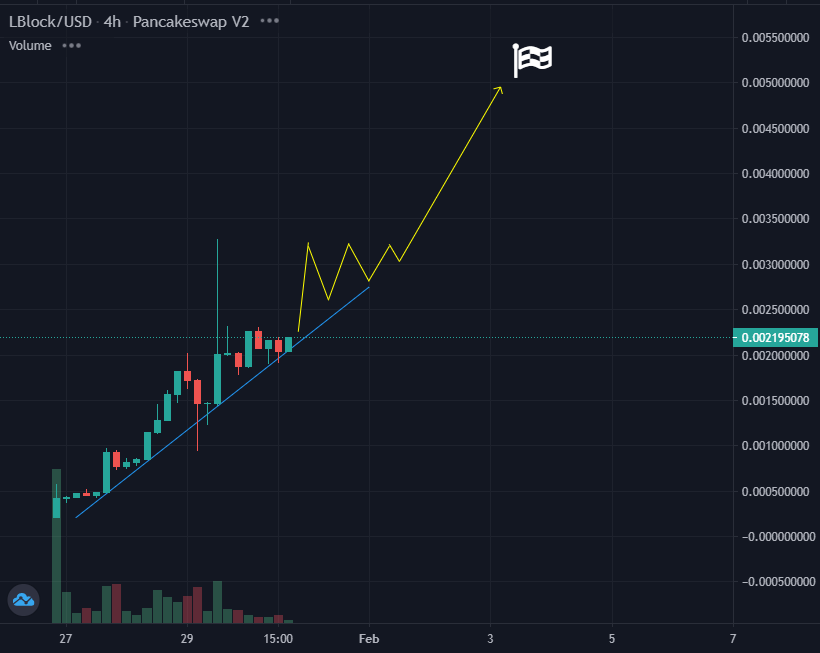
We’ll attempt to make short-term Lucky Block predictions based on the 4 hour and daily chart, the highest timeframes available. Based on the 4h chart above, LBLOCK is respecting a diagonal support line in its uptrend.
No 4h candles have closed below that line – two wicks below in the first few days of trading were quickly bought up by buyers. The largest upward price spike also began from that trend line, a $250k buy.
This weekend has seen only one wick below that trend line and at the time of writing a bullish engulfing 4h candlestick is forming. Price wicks usually get filled so if no 4h candles start to close and open below that trend line, we could expect the bullish uptrend to continue and fill that wick to the upside.
We’d expect the top of the wick to act as resistance the first time its tested, and a rising wedge pattern to form as the price grinds up, between support and resistance.
If a 4h candle closes above the previous all-time high of $0.0031 Lucky Block will enter price discovery and potentially head to a psychological resistance and take profit point for some investors of $0.0050. At that price the diluted Lucky Block market cap would also hit around $500 million.
LBLOCK could pump higher than that as large holders (over $10,000 in tokens) are subject to a 3+ month lockup period before being able to sell. The largest presale investors have a smart contract lockup of 12 months. There is also a 12% transactional fee in place to disincentivize selling and reward holders.
Lucky Block Price Action – Daily Chart
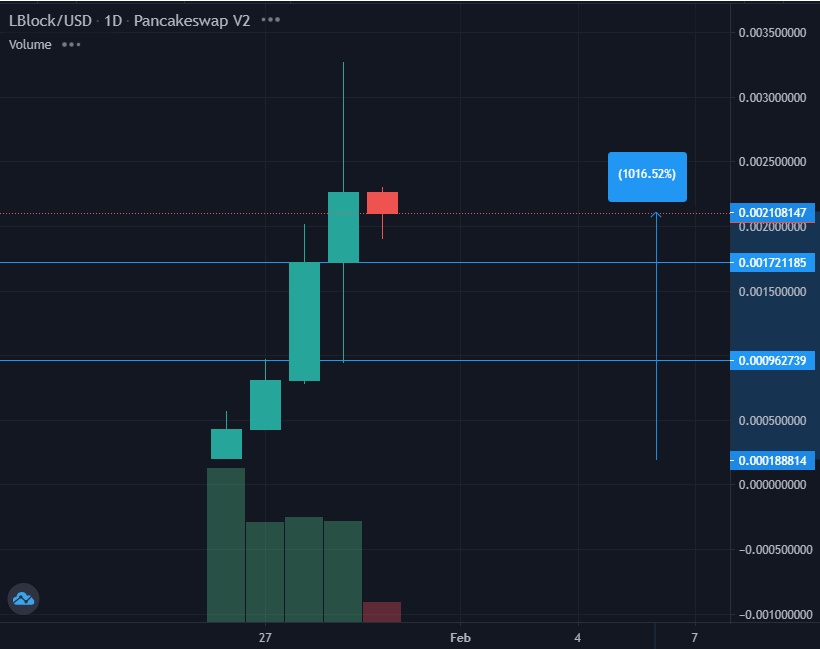
LBLOCK / USD via Coingecko
Two horizontal support lines can be drawn on the daily chart. The lowest, at $0.0010 is clearer – that price acted as resistance on the second day of trading, marking that day’s high (the top of the wick). It was then retested on the fourth day of trading, marking that day’s bottom before a strong bounce.
This clean support / resistance flip suggests that $0.0010 is strong support.
LBLOCK is also finding support at the $0.0017 – $0.0019 area, around the Friday close which the daily candle closed above on Saturday, and then didn’t wick below on Sunday.
That area is slightly below the diagonal support line on the 4h chart, explaining why price was quickly bought up when it approached that area, forming a wick. Buyers showed interest in that area.
The charts above are viewed by searching LBLOCK on Coingecko.com and clicking the ‘Live Chart’ button. On the window that opens you’ll be able to do technical analysis using Tradingview indicators, to come up with your own Lucky Block price predictions.
Or you can view the Lucky Block trading volume, liquidity and a simpler price chart on Pancakeswap.finance.
Cryptocurrency markets are highly volatile and your investments are at risk.
Join Our Telegram channel to stay up to date on breaking news coverage