Join Our Telegram channel to stay up to date on breaking news coverage
LTC Price Prediction – April 29
The Litecoin (LTC) is bearish as the market has been consolidating for the past few hours below the resistance level of $260.
LTC/USD Market
Key Levels:
Resistance levels: $300, $320, $340
Support levels: $200, $180, $160
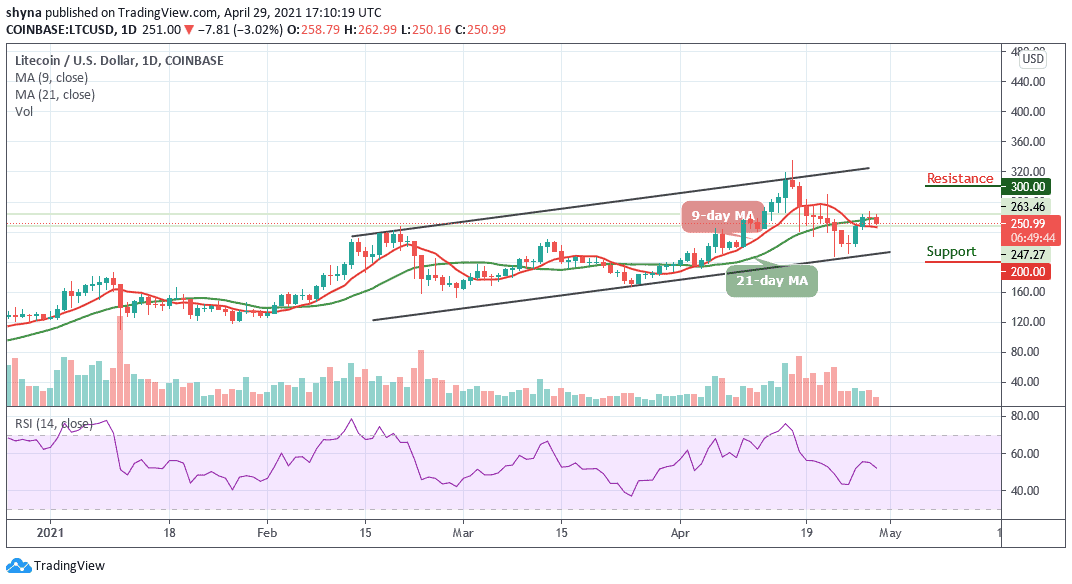
At the time of writing, LTC/USD has been trading down around 3.02% at its current price of $250.99; the coin is down slightly from its daily high of $262.99. Meanwhile, while zooming out and looking at Litecoin’s price action for the past few day’s trading periods, it is clear how much volatility it has been incurring, as it is now, the price is trading within the 9-day and 21-day moving averages.
What to Expect from Litecoin (LTC)
From above, the nearest resistance level lies above the $260 level. Therefore, if the buyers can climb above this level, further resistance levels may be located at $300, $320, and $340. On the other hand, if the market price crosses below the 9-day MA, it may likely hit the nearest support at $230.
In addition, if the sellers continue to push the price towards the lower boundary of the channel, then, the $200, $180, and $160 support levels could be touched. At the moment, the technical indicator RSI (14) is seen moving below the 55-level, suggesting more bearish signals into the market.
Comparing with BTC, the Litecoin price is moving up above the 9-day and 21-day moving averages. Looking at the daily chart, the bulls are trading at 4761 SAT within the channel. The daily chart also reveals that the market is still following sideways movement.
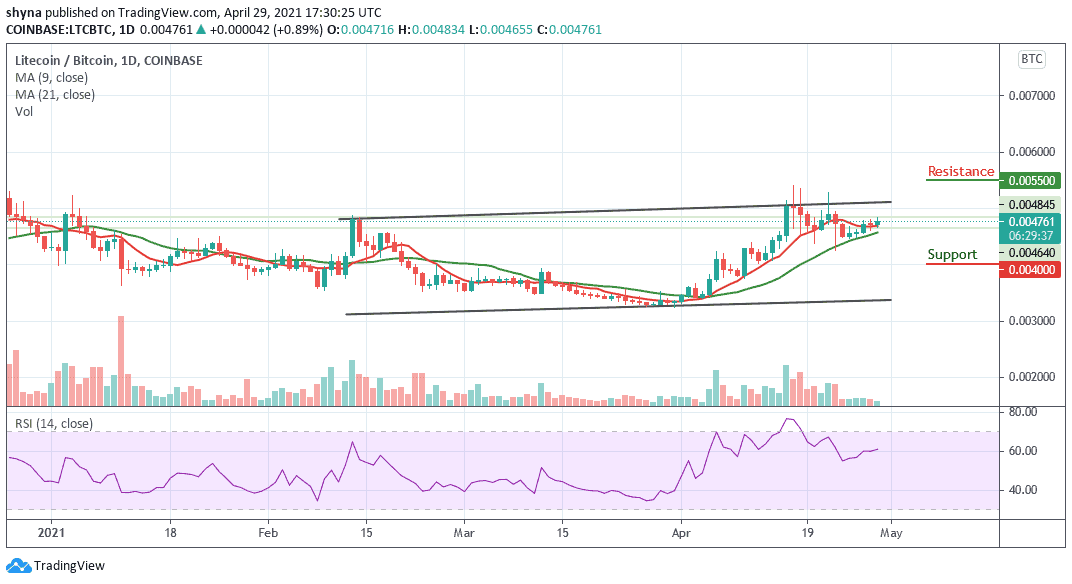
However, if the price cross below the moving averages, the nearest key support lie at 4500 SAT, but further support could be found at 4000 SAT and below in a subsequent move. Similarly, an upward movement above the moving averages may likely find immediate resistance at 5000 SAT, If the bulls climb above the upper boundary of the channel, higher resistance lies at 5500 SAT and above. Meanwhile, the technical indicator RSI (14) is moving above the 60-level.
Join Our Telegram channel to stay up to date on breaking news coverage