Join Our Telegram channel to stay up to date on breaking news coverage
LTC Price Prediction – April 19
Today, Litecoin’s price drops below the 9-day moving average following the current bearish action in the market.
LTC/USD Market
Key Levels:
Resistance levels: $300, $310, $320
Support levels: $215, $205, $195
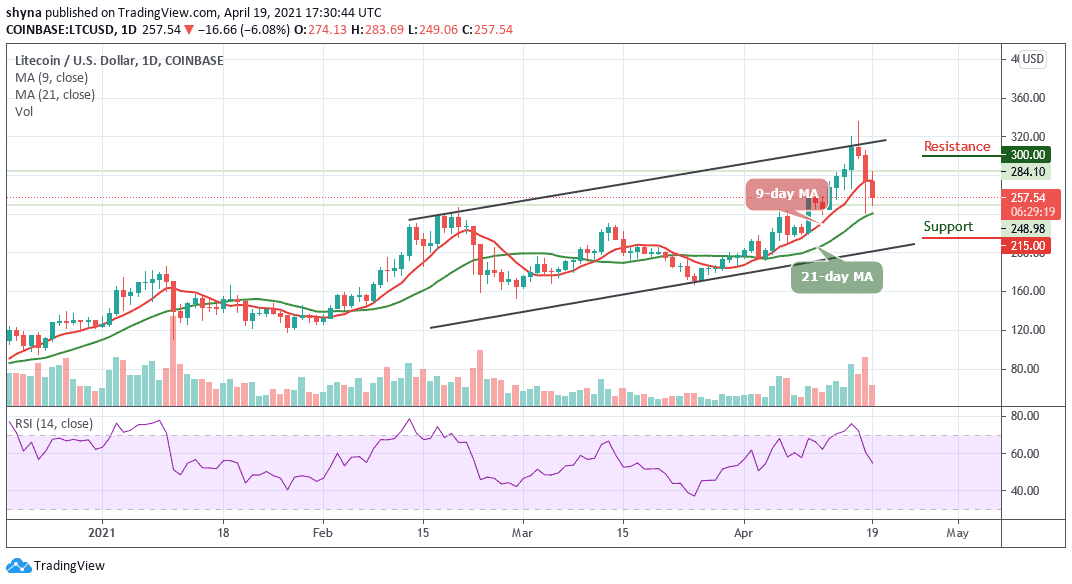
The daily chart reveals that LTC/USD has been recording some losses in the last 3 days consecutively. The Litecoin price started following the bearish trend after touching the monthly high of $335.35. However, the cryptocurrency is seen following the downward movement by touching the daily low at $249.06. At the time of writing, the Litecoin price is currently trading below the 9-day moving average and sliding towards the 21-day moving average as the price may still cross below the lower boundary of the channel.
Where is LTC Price Going Next?
As the coin fails to recover from the current trading levels, it is likely that traders may see the cryptocurrency fall to a new trading low. Meanwhile, a break below the $240 support level may provoke an even deeper decline towards the $215, $205, and $195 support levels. However, the short-term technical analysis shows that the support at the 21-day moving average may likely serve as strong support for the coin.
In other words, looking at the daily chart, a break above the $285 level may propel Litecoin to move towards the nearest resistance level of $290; a further push could take it to the resistance levels of $300, $310, and $320 respectively. As it stands now, the technical indicator RSI (14) faces the south by crossing below the 60-level which may cause the market to experience an additional deep fall.
When compares with Bitcoin, Litecoin (LTC) is still experiencing another downtrend within the channel, especially in the past few days. The coin may likely break below another solid support at 4500 SAT and could slide through the subsequent support level to 4300 SAT. The critical support level is located at the 4000 SAT and below.
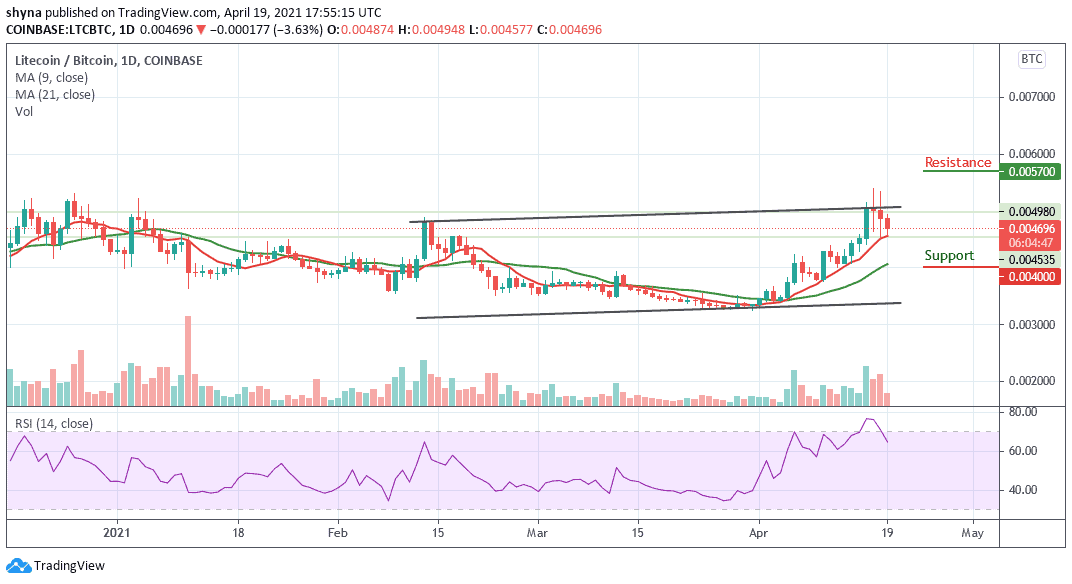
However, if the bulls manage to power the market, we may likely find the resistance level at 5700 SAT and above. Meanwhile, the Litecoin price is currently changing hands at 4696 SAT but a surge in volatility may occur as the RSI (14) may cross below the 60-level, which suggests that more bearish signals could play out.
Join Our Telegram channel to stay up to date on breaking news coverage