Join Our Telegram channel to stay up to date on breaking news coverage
Bitcoin (BTC) Price Prediction – April 19
BTC/USD is currently in the hands of the sellers but consolidation is likely to take place.
BTC/USD Long-term Trend: Bullish (Daily Chart)
Key levels:
Resistance Levels: $62,000, $64,000, $66,000
Support Levels: $50,000, $48,000, $46,000
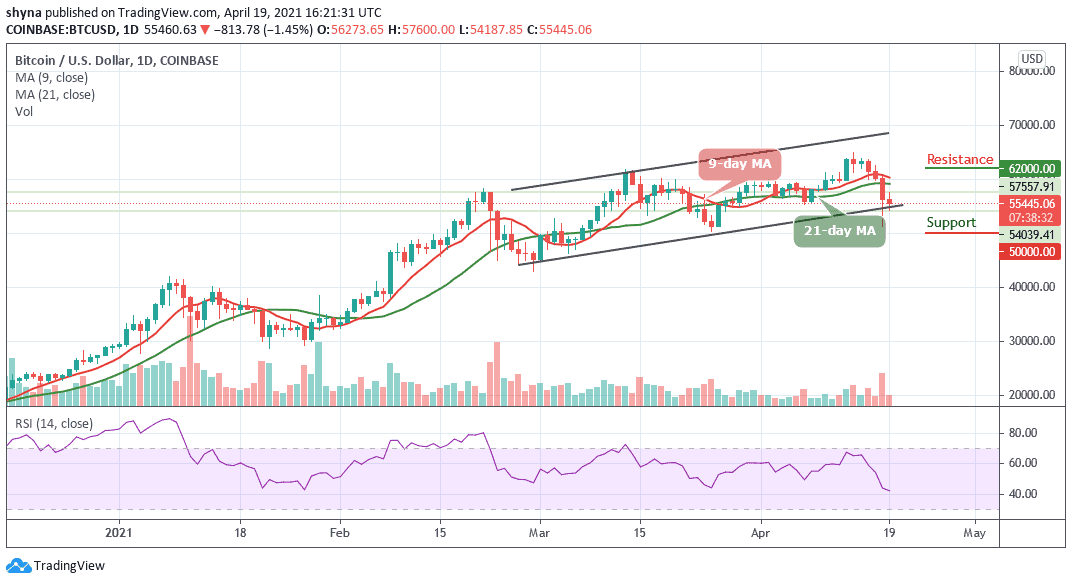
According to the daily chart, BTC/USD has not been able to break above the resistance level of $58,000 with the current consolidation pattern. The coin fails to close above the $57,600 level after which it sees a sharp drop below the 9-day and 21-day moving averages. However, the first support level is located below the lower boundary of the channel around $52,000.
What to Expect from Bitcoin (BTC)
The Bitcoin price has continued to move around the lower boundary of the channel, the coin may set up another few days of negative price declines beneath $55,000. Meanwhile, a break above the previous level would have set the first digital asset up to retest the $57,000 level. On the other hand, the technical indicator RSI (14) may follow the downward movement as the signal faces the 40-level. The supports to watch are located at $50,000, $48,000, and $46,000 respectively.
Furthermore, we can clearly see the number-one crypto failing to break below the channel. Today, the Bitcoin price touches the daily high of $57,600 but later dropped back beneath the $56,000 level. Nevertheless, the daily candle is still yet to close and it does look unlikely that the bulls may end up closing above this level. More so, toward the upside, resistance lies at $62,000, $64,000, and $66,000.
BTC/USD Medium-Term Trend: Ranging (4H Chart)
The 4-hour chart shows that the Bitcoin bears are now stepping back into the market pushing the BTC price below its previous support level that existed around $54,800. Although the Bitcoin price has not yet slipped below the lower boundary of the channel, according to the technical indicator, it’s still in the loop of making a bounce back.
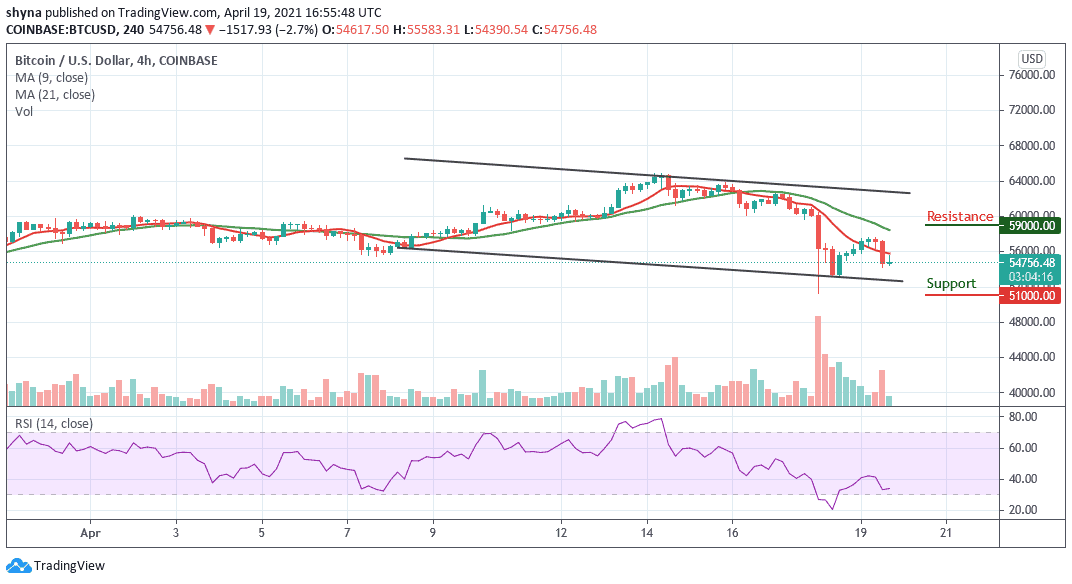
At the moment, BTC/USD is currently moving below the 9-day and 21-day moving averages. If the coin crosses above the 9-day MA, the upward movement may likely push the price to the nearest resistance at $59,000, and above while crossing below the channel may hit the support at $51,000 and below. However, the RSI (14) is focusing on the oversold territory, which indicates more bearish movement within the market.
Join Our Telegram channel to stay up to date on breaking news coverage