Join Our Telegram channel to stay up to date on breaking news coverage
LTC Price Prediction – April 10
The Litecoin price escalates but a break above $240 is expected to pull the coin towards $250 in the coming trading sessions.
LTC/USD Market
Key Levels:
Resistance levels: $250, $260, $270
Support levels: $200, $190, $180

LTC/USD is seen trading around the resistance level of $230 after touching the daily high of $235.37 in the early hours of today. This is a move that could easily pave the way for gains above $240 and towards $250. Therefore, if the technical indicator RSI (14) keeps moving above the 60-level, the market may show that the bullish grip is getting stronger.
Where is LTC Price Going Next?
The Litecoin (LTC) is currently holding the ground at above the 9-day and 21-day moving averages after a major recovery from $219.02. This shows that buyers still have the upper hand in the price movement and they could easily push the coin towards the potential resistance of $250, $260, and $270. In the other words, if the buying action fails to break above $240, then LTC/USD could instead settle for consolidation.
However, any breakout above the upper boundary of the channel is still having an impact on the price. Furthermore, it is about time that buyers increase their confidence in the recovery because $240 is still achievable. Therefore, if the bears push the coin below the moving averages, the support levels of $200, $190, and $180 may be touched.
Against Bitcoin, LTC remains above the 9-day and 21-day moving averages in other to retest the resistance level of 4000 SAT. Unless this resistance is effectively exceeded and the price eventually closes above it, there might not be any reason to expect the long-term bullish reversal.
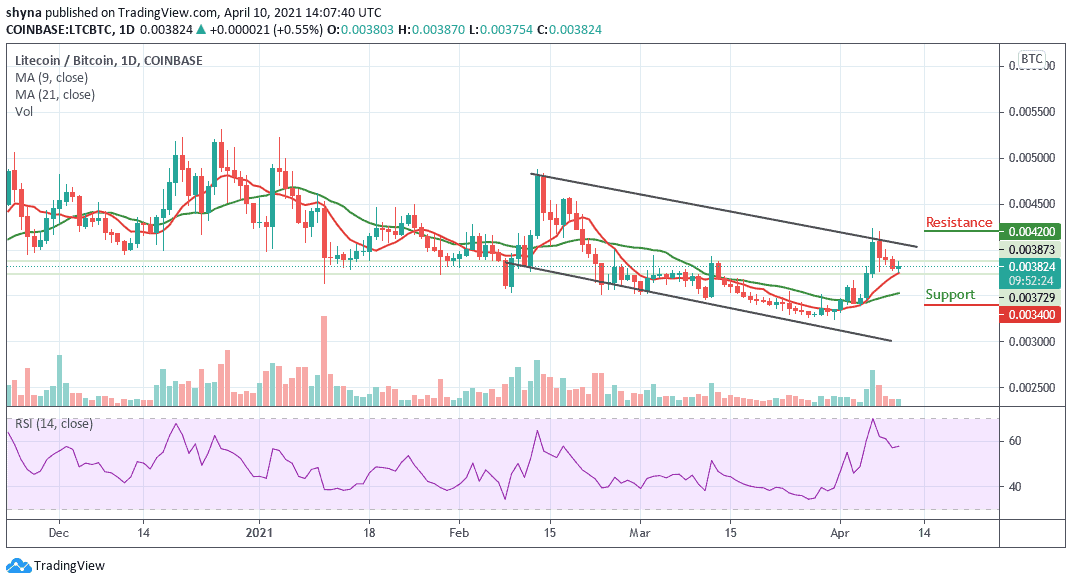
Moreover, trading below the moving averages could recall the lows and a possible bearish continuation may likely meet the major support at 3500 SAT before falling to 3400 SAT and below while the buyers may need to push the market to the potential resistances at 4200 SAT and above as the technical indicator RSI (14) is likely to cross above 60-level to give more bullish signals.
Join Our Telegram channel to stay up to date on breaking news coverage