Join Our Telegram channel to stay up to date on breaking news coverage
LTC Price Prediction – April 8
LTC/USD is likely to show an upward trend if the market can rise above the $230 resistance level.
LTC/USD Market
Key Levels:
Resistance levels: $250, $260, $270
Support levels: $200, $190, $180
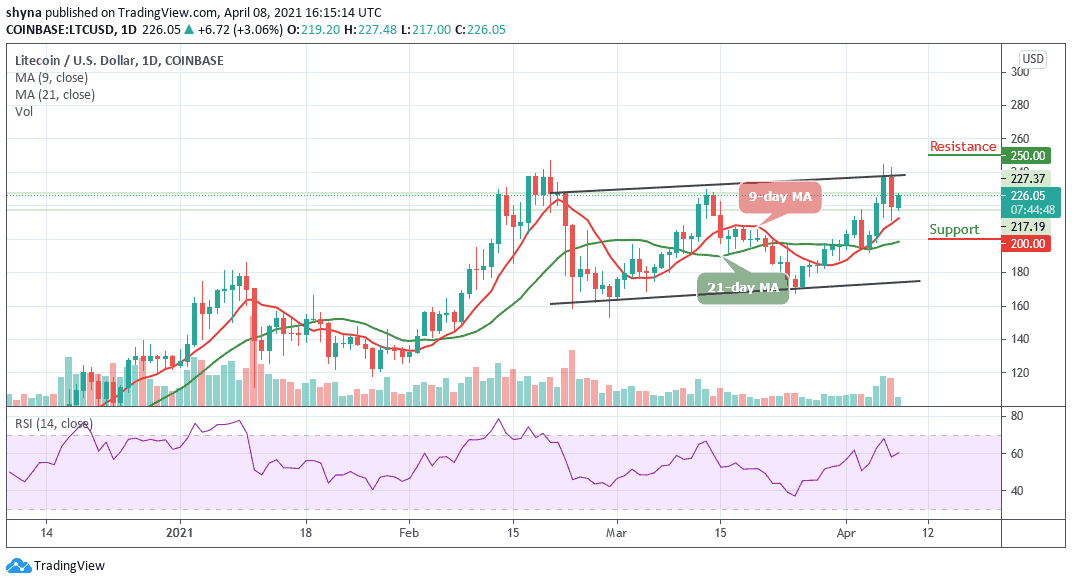
Looking at the daily chart, LTC/USD is currently showing a positive movement over the past few hours. The market is actually running a little retracement move towards $230 with a price growth of 3.06%. Aside from today’s gain, the Litecoin price is still maintaining an upward movement within the channel and traders can expect the price to continue to rise as soon as the bulls put more pressure on the market.
What to Expect from Litecoin (LTC)
If the price can keep respecting the upward movement, traders can then expect a bullish continuation after testing the $215 support. As the technical indicator, RSI (14) crosses above the 60-level; the potential resistance levels are located at $250, $260, and $270 in the long term.
Moreover, if the coin continues to maintain the rising channel pattern as reveals by the daily chart, traders may witness a more bullish trend. Meanwhile, looking at the price formation, a bearish breakdown may likely play out for this market and this could roll the coin back to the long-term support at $200, $190, and $180 levels.
When compares with Bitcoin, the Litecoin price is currently following a bearish sentiment, trading above the 9-day and 21-day moving averages within the descending channel. However, if the bears attempt to gain momentum, they are likely to keep releasing huge pressure on the market as the technical indicator RSI (14) slides toward the 60-level, suggesting more bearish signals.
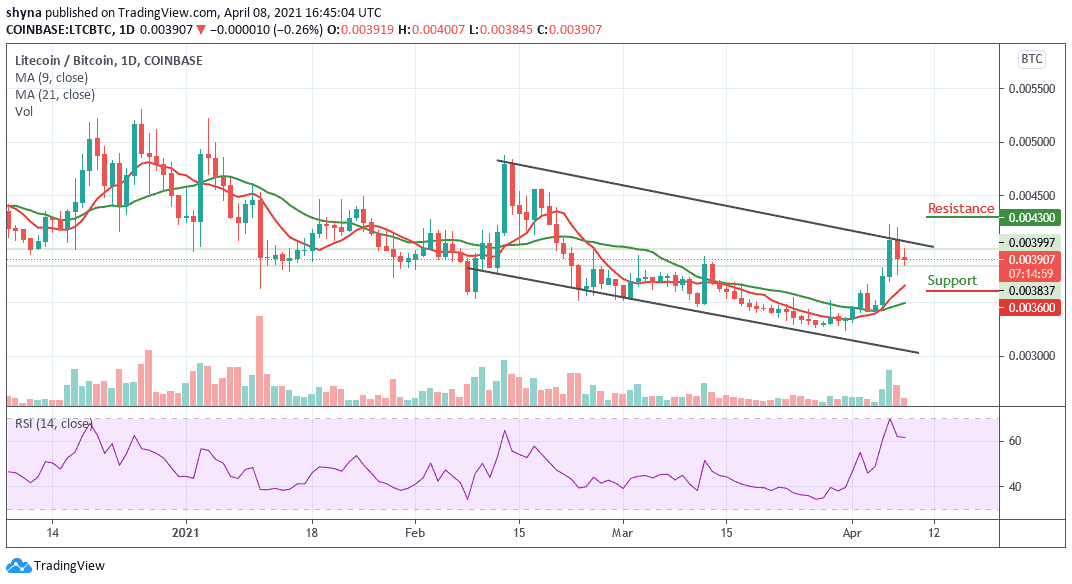
However, if the pair falls below the 9-day moving average, it may likely hit the nearest support at 3650 SAT. Any further negative movement could significantly lower the price to 3600 SAT and below. In case of a rebound, the coin may trade above the upper boundary of the channel. If the bulls manage to stay well above this barrier, traders could see a bull-run to the resistance level of 4300 SAT and above.
Join Our Telegram channel to stay up to date on breaking news coverage