Join Our Telegram channel to stay up to date on breaking news coverage
LTC Price Prediction – April 3
The price of Litecoin is currently changing hands at $214 as the coin prepares to move higher.
LTC/USD Market
Key Levels:
Resistance levels: $235, $245, $255
Support levels: $190, $180, $170
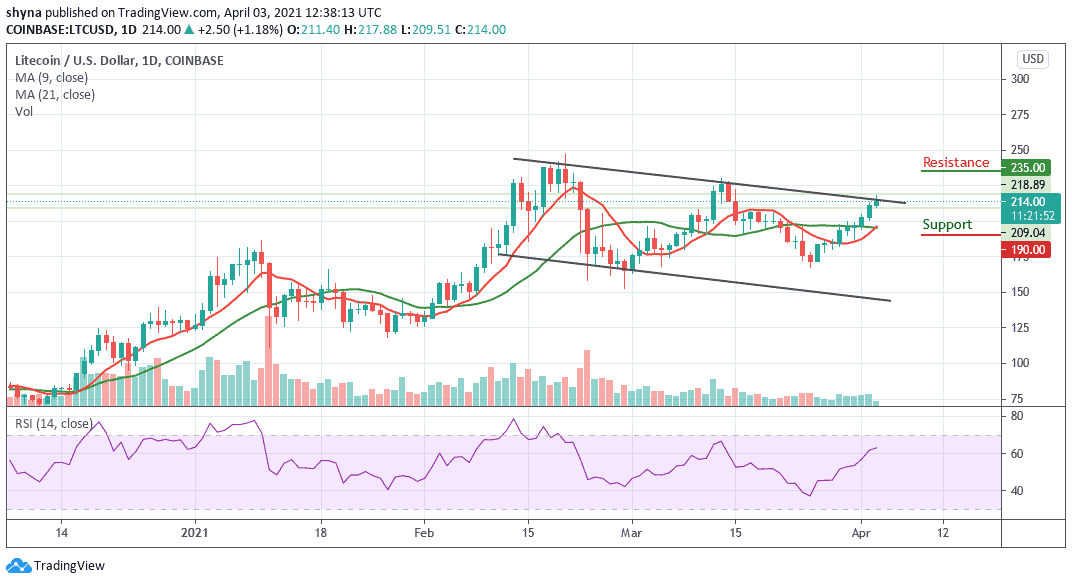
LTC/USD is now moving above the 9-day and 21-day moving averages where the coin is making an attempt to cross above the upper boundary channel. A climb above the previous resistance level at $220 could allow the bulls to maintain and move the price to the higher highs. Meanwhile, the current price setups reveal that bears may come to play if the 9-day MA refused to cross above the 21-day MA.
What to Expect from Litecoin
As stated above, LTC/USD is maintaining the uptrend as the coin moves toward the resistance of $220. An increase above this initial resistance could trigger intense buying to $235, $245, and $255 resistance levels. Looking at the downside, the Litecoin price may likely hold a support level at $209 which is the current daily low.
Meanwhile, the next support after this is located at $190 where it may even dip to $180 and $170 supports if the selling volume comes to play. Nevertheless, the technical indicator RSI (14) reveals that the market may continue to follow the bullish movement if the signal line crosses above the 70-level.
When compares with Bitcoin, Litecoin price is making an attempt to cross the upper boundary of the channel in other to reach the resistance at 3800 SAT. Unless this resistance is effectively exceeded and the price ends up closing above it, there might not be any reason to expect the long-term bullish reversal.
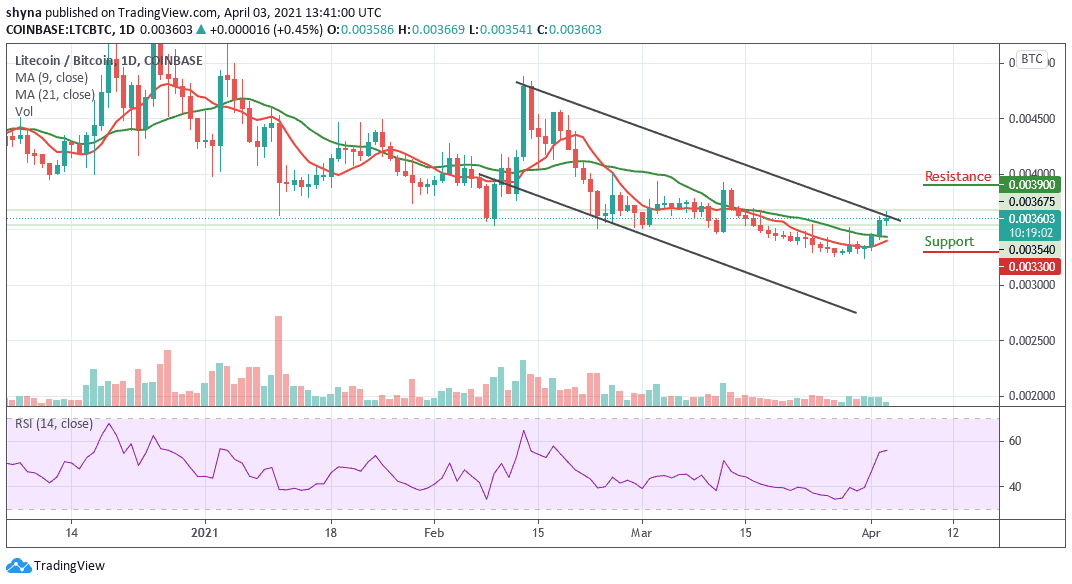
However, trading below the moving averages could refresh lows under 3400 SAT and a possible bearish continuation may likely meet the major support at 3300 SAT and below while the buyers may push the coin to the potential resistance at 3900 SAT and above. More so, the technical indicator RSI (14) moves toward the 60-level to give more bullish signals.
Join Our Telegram channel to stay up to date on breaking news coverage