Join Our Telegram channel to stay up to date on breaking news coverage
LTC Price Prediction – April 1
The Litecoin price may likely settle above the 9-day and 21-day moving averages as the RSI (14) moves toward 60-level.
LTC/USD Market
Key Levels:
Resistance levels: $225, $235, $245
Support levels: $175, $165, $155
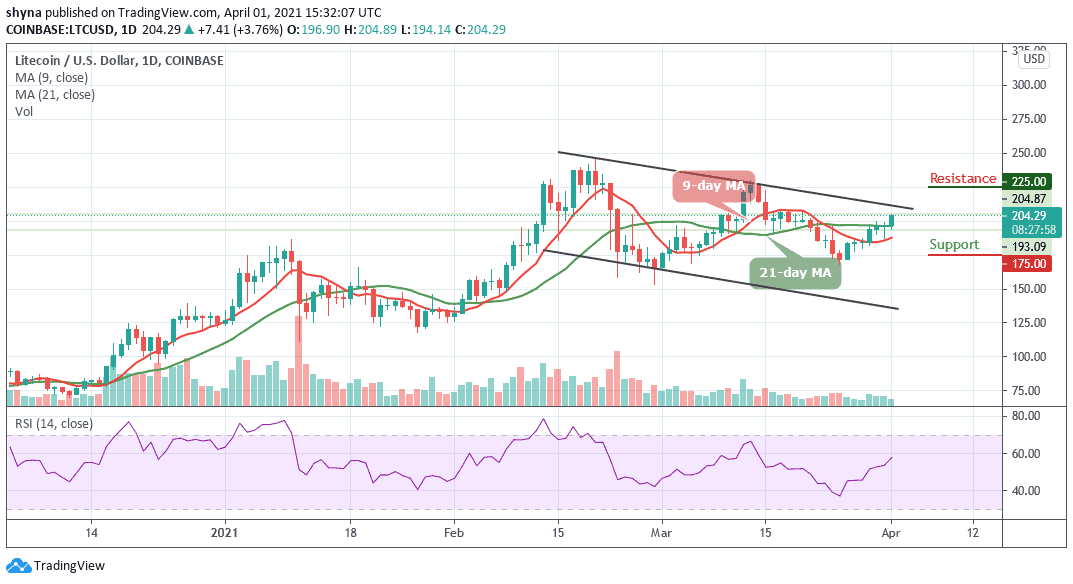
LTC/USD is currently trading above the 9-day and 21-day moving averages within the channel. However, the cryptocurrency has been following an uptrend for the past few days, and should the buyers keep it above the moving averages, the coin might remain at the upside. Today, an early trading session touches the $204.89 level before rebounding to where it is trading currently at $204.29.
What is the Next Direction for Litecoin?
The Litecoin price remains firm above the moving averages and if the resistance of $205 gives way, the bull-run may come to focus. At the moment, the bullish scenario seems more dominant as buyers continue to post firm commitments into the market. For the past few days, we could see a sharp rise in the market price. Moreover, if the coin stays above the $200 resistance level, this could further strengthen the market to $225, $235, and $240 resistance levels.
On the downside, a lower possible swing may likely retest the previous support below the moving averages. However, if the bears manage to fuel the market, traders may expect a further drop to $175, $165, and $155 support levels. On the other hand, the technical indicator RSI (14) is now moving towards 60-level, indicating that the market may retain the bullish trend.
Comparing with Bitcoin, the Litecoin price crosses above the moving averages in other to reach the resistance level of 3455 SAT. More so, this resistance level is expected to effectively exceed so that the market price may end up closing above it, there might not be any reason to expect the long-term bullish reversal.
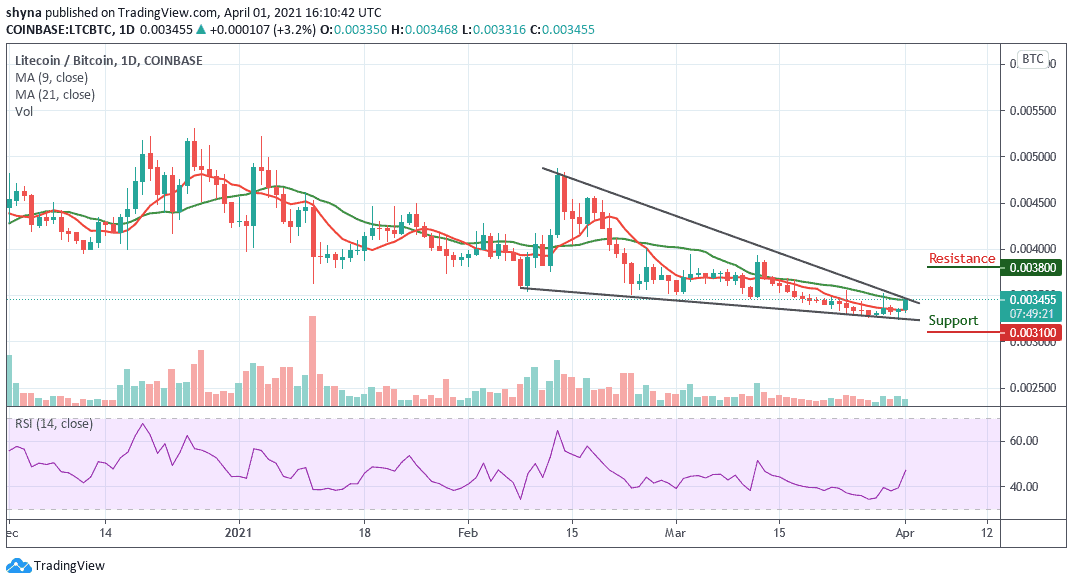
On the other hand, if the price trades below the lower boundary of the channel, it could refresh lows under 3300 SAT and a possible bearish continuation may likely meet the major support at 3200 SAT before falling to 3100 SAT and below while the buyers may push the coin to the potential resistance at 3800 SAT and above. To support the bullish movement, the technical indicator RSI (14) is moving toward the north to give more bullish signals.
Join Our Telegram channel to stay up to date on breaking news coverage