Join Our Telegram channel to stay up to date on breaking news coverage
LTC Price Prediction – February 1
The daily chart shows that the Litecoin (LTC) could not climb above the $150 level as the price touches the low of $126.
LTC/USD Market
Key Levels:
Resistance levels: $165, $175, $185
Support levels: $100, $90, $80
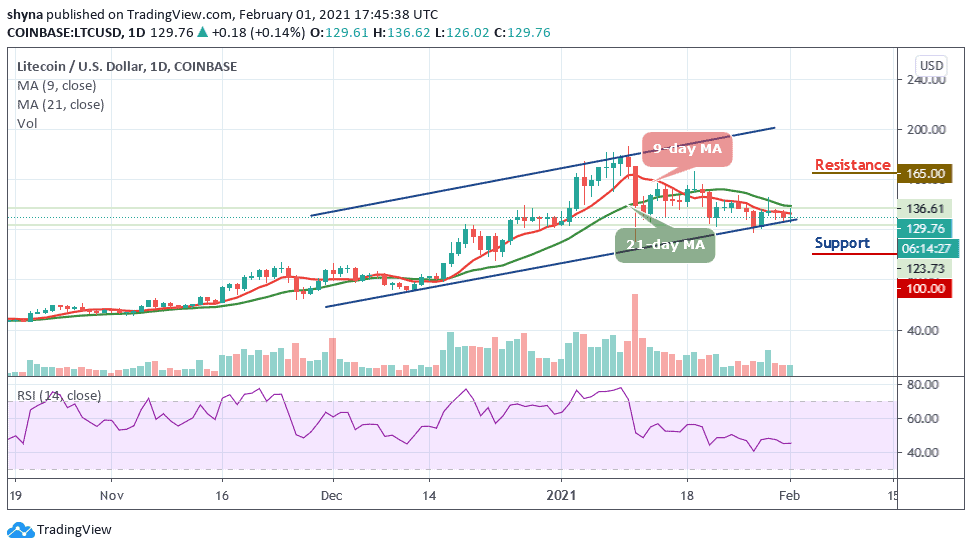
Despite an uptick in other cryptos, LTC/USD is currently struggling to gather momentum above the $130 level. Meanwhile, a key level of support remains at $126, but if that breaks with a daily candle close below the level, it may likely slump below the lower boundary of the channel.
What to Expect from Litecoin
The Litecoin price is currently trading below the 9-day and w1-day moving averages. However, if the market price crosses above the moving averages, it can enjoy a period of bullish momentum and it could target the $145 resistance level before potentially looking towards the resistance levels of $165, $175, and $185. Meanwhile, for that to happen, the coin would need a healthy injection of trade volume.
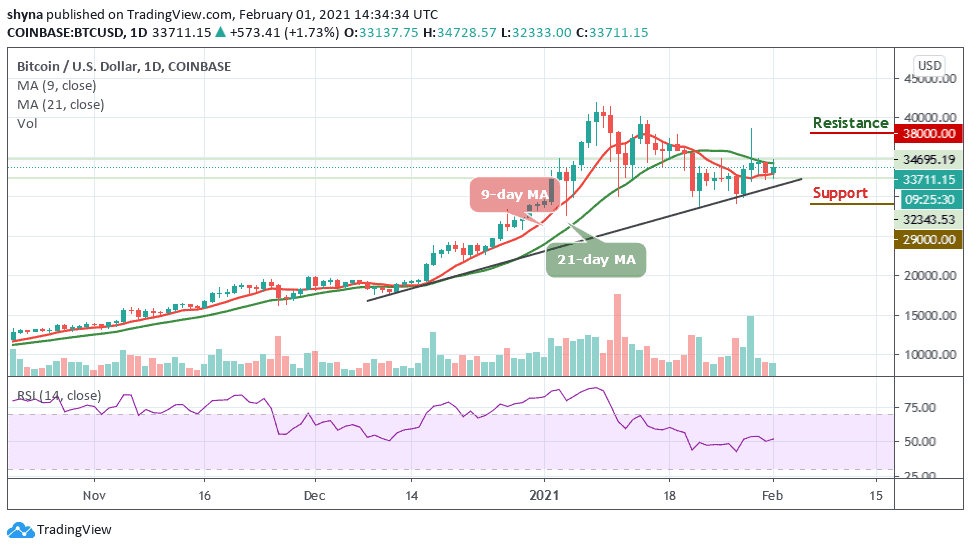
Therefore, if Bitcoin (BTC) suffers a breakdown in price below $30,000, Litecoin may likely suffer a worse fate as it would confirm a downtrend with lower highs and lower lows. Should in case the price decides to stay below the channel, the coin may likely find the critical supports at $100, $90, and $80 as the technical indicator RSI (14) suggests a sideways movement.
When compares with Bitcoin, the Litecoin price is currently following a bearish sentiment, trading under the 9-day and 21-day moving averages within the descending channel. However, if the bulls attempt to gain momentum, the bears are likely to keep releasing a huge pressure on the market as the technical indicator RSI (14) slides below 40-level, suggesting more bearish signals.
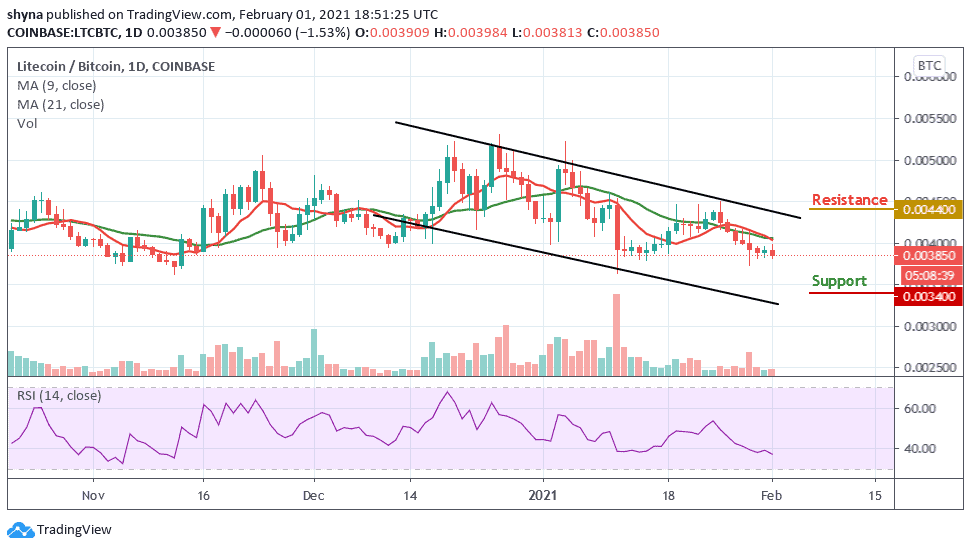
However, if LTC/BTC falls toward the lower boundary of the channel, it may likely hit the nearest support at 3600 SAT. Any further negative movement could significantly lower the price to 3400 SAT and below. In case of a rebound, the coin can test the 4200 SAT above the moving averages before resuming the rally. If the bulls manage to stay well above this barrier, traders could see a bull-run to the resistance level of 4400 SAT and above.
Join Our Telegram channel to stay up to date on breaking news coverage