Join Our Telegram channel to stay up to date on breaking news coverage
Bitcoin (BTC) Price Prediction – February 1
Bitcoin (BTC) bounces off the support at $32,000 and added more than $500 to its current value.
BTC/USD Long-term Trend: Ranging (Daily Chart)
Key levels:
Resistance Levels: $38,000, $40,000, $42,000
Support Levels: $29,000, $27,000, $25,000
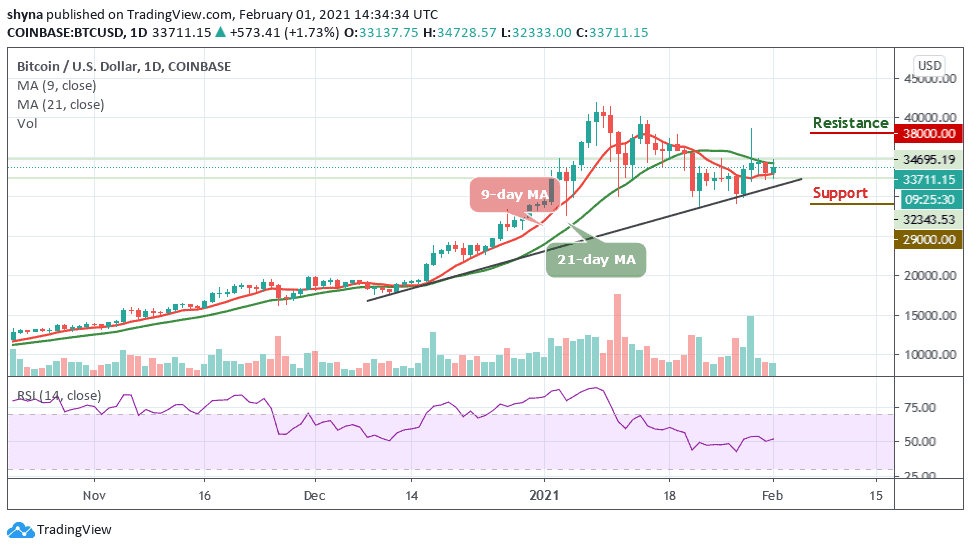
BTC/USD is currently trading around $33,711 with a 1.73% gain in the past 24-hour. According to the daily chart, since the beginning of today’s trading, the Bitcoin price fights to stay above the important level of $33,000. More so, for BTC/USD to remain above $32,000 for the past few days, it has made many traders feel that the $30,000 support level could be pretty strong.
Where is BTC Price Going Next?
BTC/USD touches the daily low of $32,333 today, if the number-one crypto breaks below this level, it could test the next support lines at $31,000. Alternatively, Bitcoin has to reclaim the first resistance at $34,728 to head upwards. If successful, the primary cryptocurrency could aim at $38,000, followed by $40,000, and $42,000 resistance levels.
However, looking at the RSI (14) in the daily range, BTC/USD is not done with the downside. Despite the drop suffered, the RSI (14) is moving above the 50-level. This means that there may still be a room that could be explored by the bears. If this happens, the critical supports at $29,000, $27,000, and $25,000 may play out.
On the upside, recovery may not come easy. Therefore, traders must be aware that support will have to be sort for above $10,300 while the other seller congestion zones to keep in mind include $11,000, $11,200, and $11,400 resistance levels.
BTC/USD Medium – Term Trend: Bullish (4H Chart)
From a technical point of view, on the 4-hour chart, the technical indicator RSI (14) keeps moving below the 50-level and this supports the option of some bullish correction. Meanwhile, adding to the above, there is a little bit of bullish divergence on the RSI (14) as the signal line faces the north.
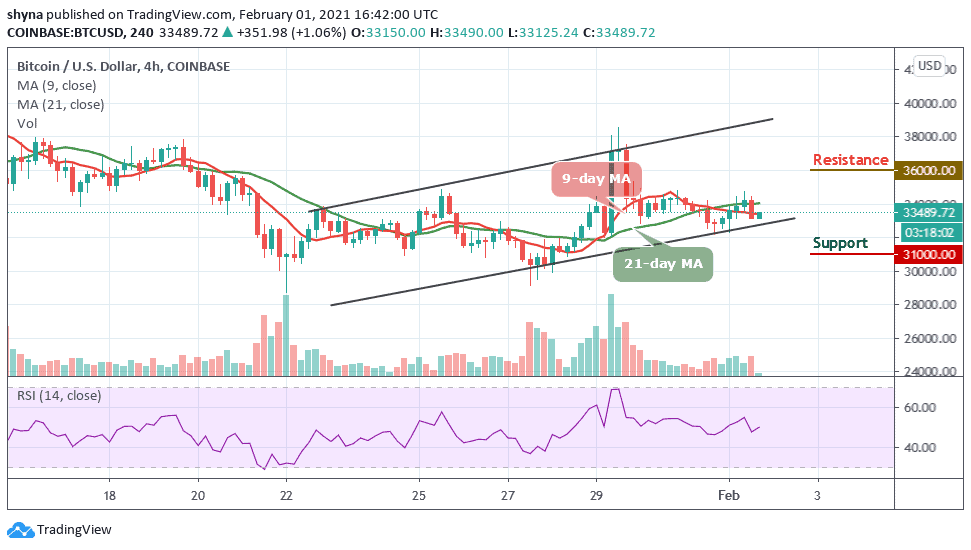
However, if the Bitcoin price breaks above the 9-day and 21-day moving averages, the market price may likely reach the resistance at $36,000 and above. On the contrary, if the current market value drops below the lower boundary of the channel, it may likely slide towards the supports at $31,000 and below.
Join Our Telegram channel to stay up to date on breaking news coverage