Join Our Telegram channel to stay up to date on breaking news coverage
LTC Price Prediction – October 28
After a strong recovery attempt, the Litecoin price reverses below the support level of $54.89
LTC/USD Market
Key Levels:
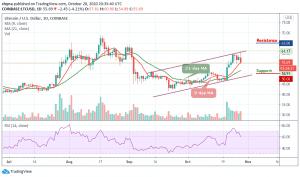
Resistance levels: $65, $67, $69
Support levels: $50, $48, $46
LTC/USD drops by over 4.0% over the past 24 hours of trading as the coin slides below the 9-day moving average to reach the $54.89 level. However, it seems that the bullish momentum is fading out quickly as the technical indicator RSI (14) plummets from the overbought conditions. A break beneath 60-level may cause the coin to follow the downtrend as the bears may take control of the market momentum.
What to Expect from Litecoin (LTC)
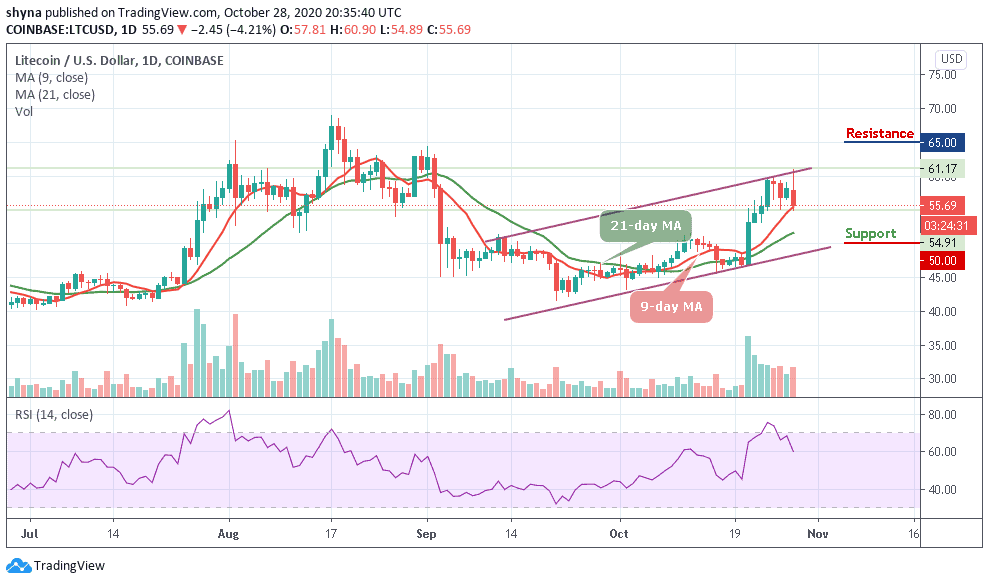
The break back beneath $58 may put Litecoin in a neutral trading position. The cryptocurrency would now need to rise and break above the $60 resistance level to turn bullish again. But it would have to drop beneath $52 to turn bearish. If the sellers do push lower, the first level of support can be found below the 9-day and 21-day moving averages at $51. This may be followed by the critical supports at $50, $48, and $46.
On the other side, if the bulls can rebound from $55 and push higher, the first level of resistance lies at $58. Above this, the potential resistance levels are located at $65, $63, and $61. As it is now, Litecoin appears to slip into retreat. The bullish outlook to $65 is unlikely to take place, at least for now. LTC/USD is exchanging hands around $55.69 while the technical indicator RSI (14) is about to cross below the 60-level for bearish confirmation.
When compares with BTC, the Litecoin price is moving in sideways below the 9-day and 21-day moving averages. The crypto is likely to follow the downward movement because the bears are now pushing the coin towards the south to hit the support level of 3900 SAT and below as the technical indicator RSI (14) drops below 45-level.
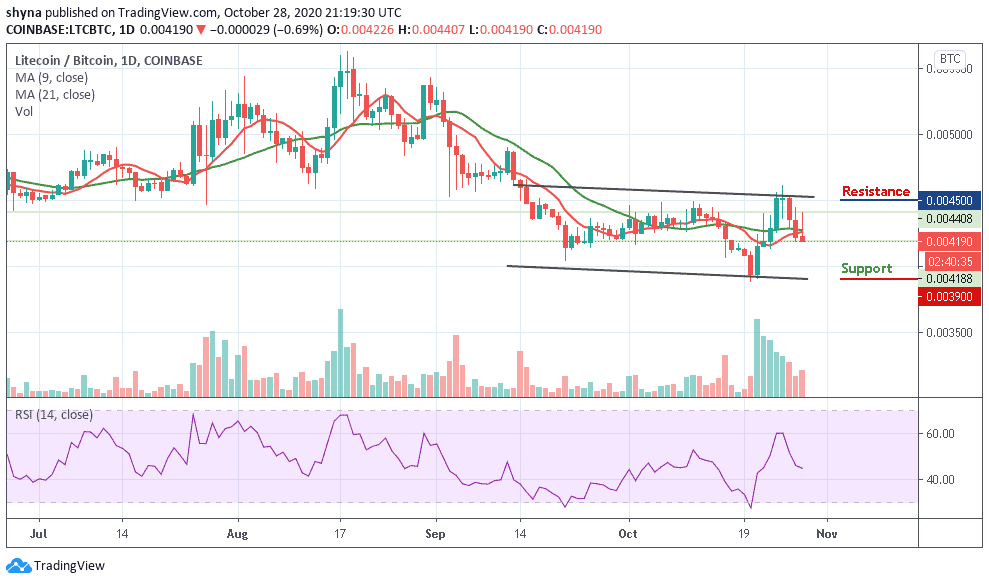
However, if the 9-day MA can successfully cross above the 21-day MA, the coin might embark on the upward movement. Therefore, any bullish movement above the moving averages could take the Litecoin price towards the resistance levels of 4500 SAT and above.
Join Our Telegram channel to stay up to date on breaking news coverage