Join Our Telegram channel to stay up to date on breaking news coverage
LTC Price Prediction – October 3
Litecoin sees a 2% price increase over the past 24 hours of trading as the cryptocurrency reaches $46.
LTC/USD Market
Key Levels:
Resistance levels: $52, $54, $56
Support levels: $38, $36, $34
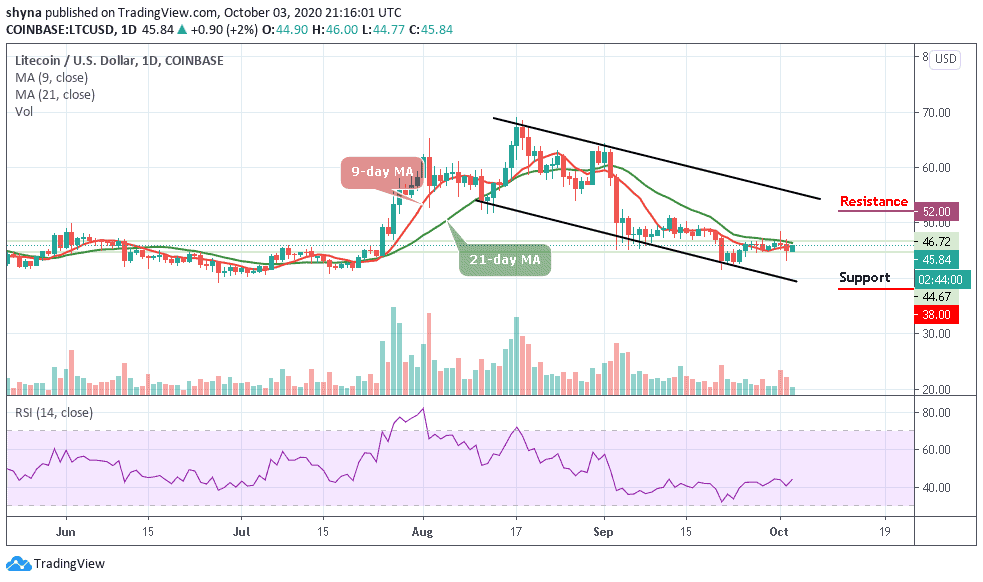
LTC/USD gains a 2% price rise over the past 24 hours of trading as the cryptocurrency bounces from $44.72 to reach $46. The coin is rebounding from a rising support trend line which prevented Litecoin from unwinding further beneath $44. The momentum has now shifted back into the bullish favor especially with the RSI (14) rebounding from the 40-level to show that the buyers are unwilling to give up their control of the market momentum just yet.
What is the Next Direction for Litecoin?
LTC/USD still remains neutral and it may need to rise above $48 to turn bullish again. But, if the sellers push the market beneath the lower boundary of the channel, then traders may consider the market as bearish in the short term. Toward the upside, the first level of resistance lies at $47 while the potential resistance levels lie at $52, $54, and $56 respectively.
Moreover, if the sellers push the price beneath the lower boundary of the channel, traders may expect support to be located at $42 and $40. Beneath this, other critical supports can be located at $38, 36, and $34 respectively.
Comparing with Bitcoin, LTC is seen trading around the 9-day and 21-day moving averages at 4335 SAT. The Litecoin price subsequently rebounded against BTC and now making an attempt to cross above the moving averages.
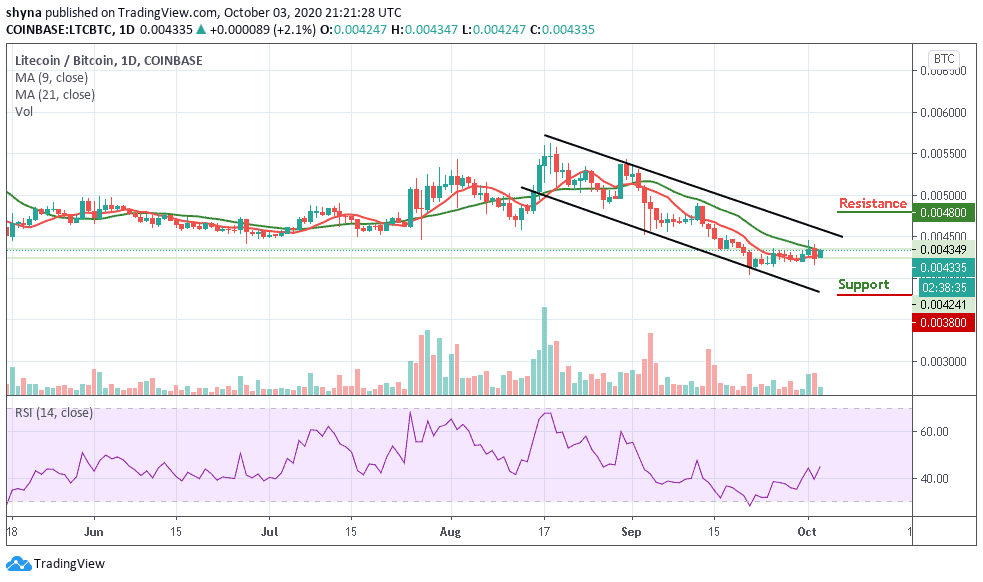
Furthermore, from above, the nearest level of resistance lies at 4500 SAT. Above this, higher resistance lies at 4800 SAT and 5000 SAT. From below; the nearest levels of support are 4200 SAT and 4100 SAT. If the selling creates a fresh low, lower support may be located at 3800 SAT and 3600 SAT. The RSI (14) moving at the 45-level shows the market preparing for an uptrend – a promising sign for the bulls.
Join Our Telegram channel to stay up to date on breaking news coverage