

Join Our Telegram channel to stay up to date on breaking news coverage
LTC Price Prediction – October 1
LTC/USD may soon need to stage a meaningful short-term rally or the cryptocurrency could see a worrying decline back towards the $36 support level.
LTC/USD Market
Key Levels:
Resistance levels: $54, $56, $58
Support levels: $38, $36, $34
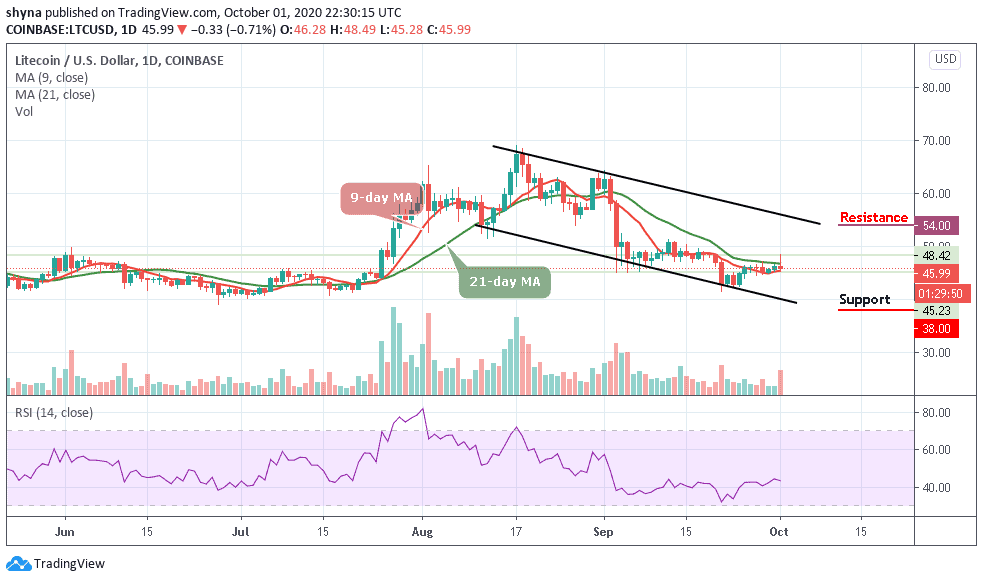
LTC/USD is still trapped in an incredibly narrow trading range after a bullish rally failed to materialize today. In fact, the cryptocurrency is trading in its tightest three days trading band since a few days ago. An early day rally towards the $50 level failed to generate sustainable gains, with the LTC/USD pair slipping back under the 21-day moving average.
What to Expect from Litecoin (LTC)
The longer LTC/USD pair fails to rally from current trading levels, the greater the chance that traders may see the coin falling to a new trading low. A break below the $42 support level may provoke an even deeper decline towards the $38, $36, and $34 levels. The technical indicator RSI (14) for LTC/USD is moving around the 43.54-level, suggesting sideways movement for the market.
However, the daily chart highlights that LTC/USD bulls need to re-group and energized the market by breaking above the moving averages. However, any further bullish movements above the upper boundary of the channel could locate the resistance levels of $54, $56, and $58, and a move above this key technical metric should encourage further LTC/USD buying.
When compares with BTC, the price of Litecoin is moving in sideways in-between the 9-day and 21-day moving averages. The number eleventh crypto on the market cap is likely to follow the upward movement because the bulls have been trying to push the coin above the moving average for the past few days.
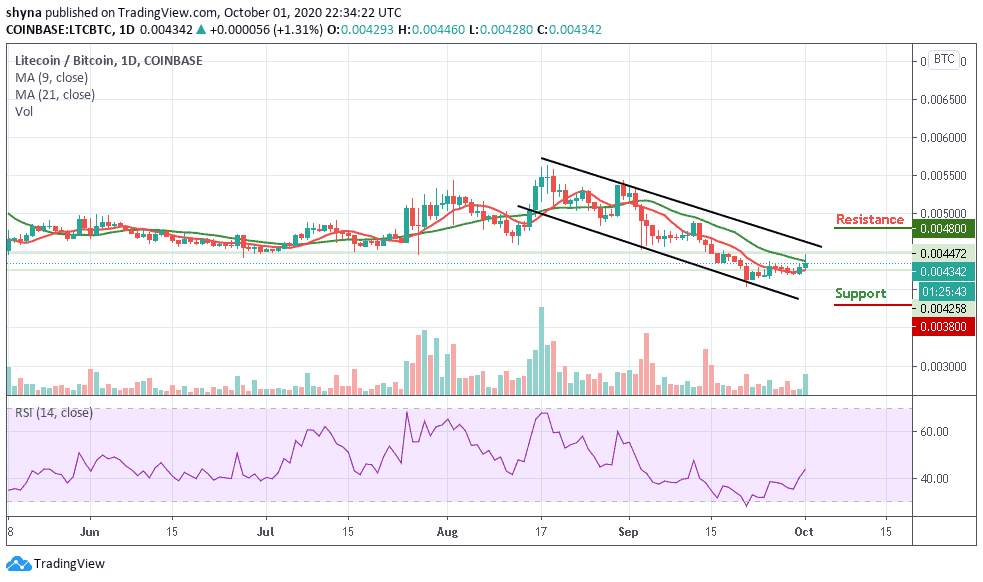
However, as the technical indicator, RSI (14) moves above the 40-level, suggesting another bullish signal but a bearish step back may likely roll the market back below the 9-day moving average with a possible break down and further declines could be at 3800 SAT and below, establishing a new monthly low for the market. Nevertheless, the resistance levels to watch are located at 4800 SAT and above.
Join Our Telegram channel to stay up to date on breaking news coverage
