Join Our Telegram channel to stay up to date on breaking news coverage
It is likely that most altcoins will complete a 3-bar bull reversal pattern known as a morning star right at key support levels in the weekly chart.
LTC, Lumens and EOS/USD will lead the charge and offer wonderful buy opportunities next week.
My advice is for buyers to wait for meaningful entries next week and not to buy at peaks at current prices.
Let’s have a look at these charts:
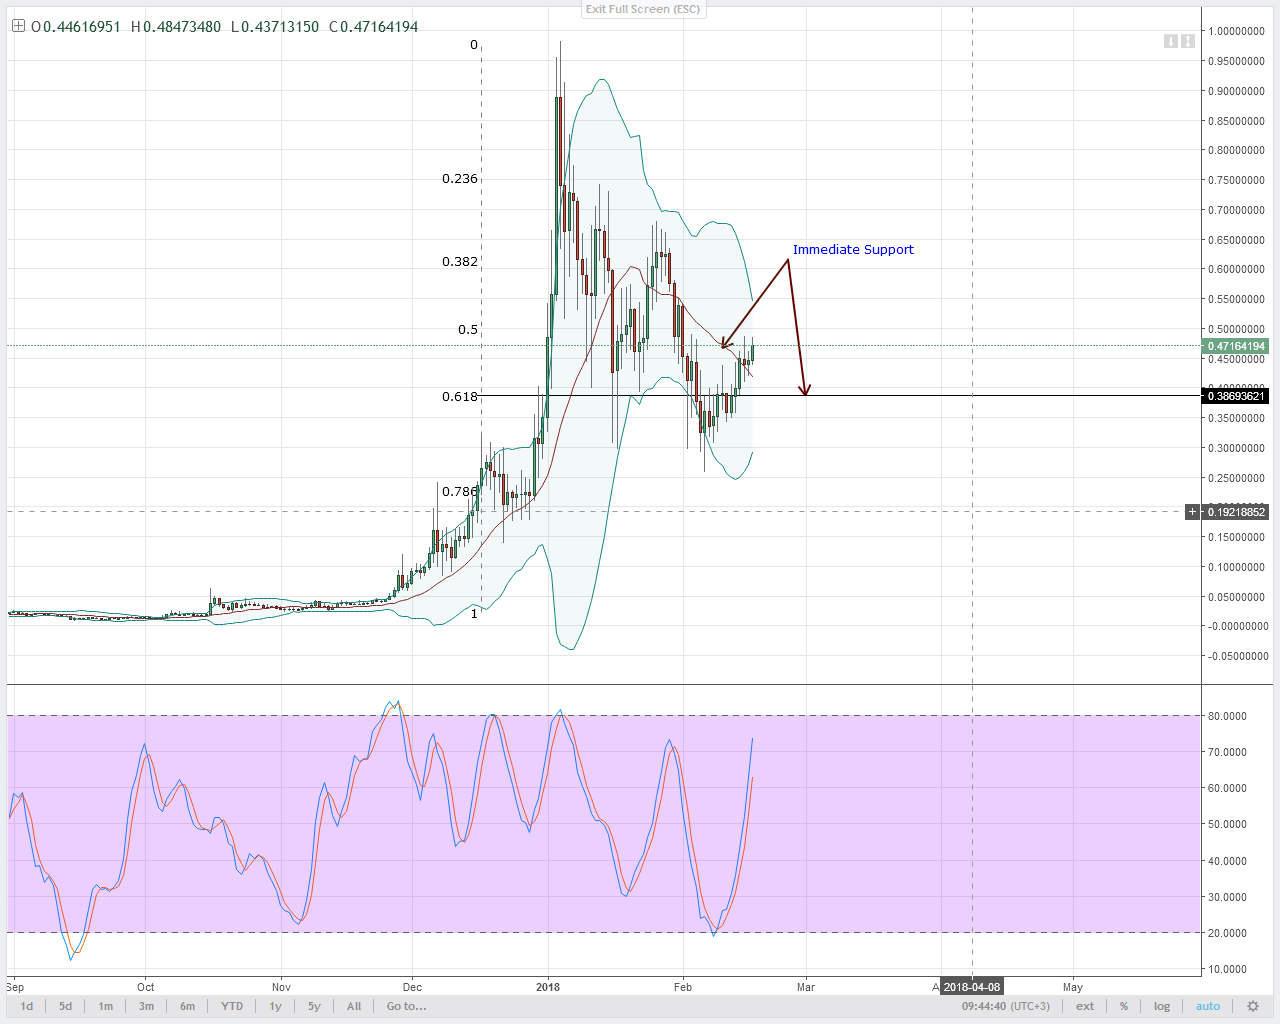
XLM/USD XLMUSD Daily Chart for February 17, 2018
In the coming sessions, trading Lumens is pretty much straight forward.
As we can see from the chart, prices are trending higher and with stochastics signals widening, it is likely that prices will continue rally-as it is doing at the moment, meaning every pull back in lower time frames is another clear buying opportunity.
Let’s not forget that we are trading from a top-down approach. If this week’s end up bullish, then there will be a sweet confirmation of a 3-bar reversal bull pattern-the Morning Star in the weekly chart.
Therefore, this means any lows that prints in lower time frames is another opportunity to buy on dips with bull targets at $0.70.
IOT/USD IOTUSD Daily Chart for February 17, 2018
Today’s candlestick looks like a sold block with no lower and upper wick-a marubozo-and this is no rocket science, it means buyers are strongly in charge.
Remember, upon checking yesterday’s candlestick we note that prices did slow down ending up bearish.
But as per our trading strategy, our recommendation is to buy on every pull back-especially to the middle BB. If we zoom to the 4HR chart, we note that prices bounced off from that line.
In this case, any higher highs is remains important from IOTA bull perspective and today we wait and see how prices react at $2.2, the mid range of this solid resistance zone.
EOS/USD EOSUSD Daily Chart for February 17, 2018
The reaction before today’s breach of the all important middle BB at around $10 has been nothing short of impressive.
Notice that before today’s bull bar, prices did stall along $9.5-our main resistance line now support with restriction on the upside by the 20 period MA.
Besides this bullish development in the main chart, the stochastics continue to hint of bullish pressure continuation.
With every diverging %k and %d, $9.5 should be a spring board and a loading zone for buyers more so if there is a pull back.
LTC/USD LTCUSD Daily Chart for February 17, 2018
Now, this week’s LTC will end up bullish not just from a technical point of view but also from supportive fundamentals-LitePay and others.
Technically, we remain bullish and trade according to a bull break out strategy. Despite prices being on a roller coaster and riding along the curves of the upper BB-note the banding, somehow, there must be a retrace back to the middle BB or even lower to $180 in the coming sessions.
That’s what we expect of such strong break outs-it happens all the time. As such, it won’t be a good idea to go long at the moment.
After all, the stagnation in the 4HR hints of bearish pressure and that’s why buyers should stay on the side lines until next week.
NEO/USD NEOUSD Daily Chart for February 17, 2018
This is exactly what we want to see and now that prices are now above $130, position traders should refine their entries and buy with every stochastic buy signal in the 4HR chart.
At the moment, we shall treat the middle BB and $130 as potential support with ideal loading positions at around $120.
Join Our Telegram channel to stay up to date on breaking news coverage