

Join Our Telegram channel to stay up to date on breaking news coverage
LTC Price Prediction – April 27
For the past few days trading, the price movement of LTC/USD has been insignificant as coin trades in a tight range.
LTC/USD Market
Key Levels:
Resistance levels: $50, $52, $54
Support levels: $38, $36, $34
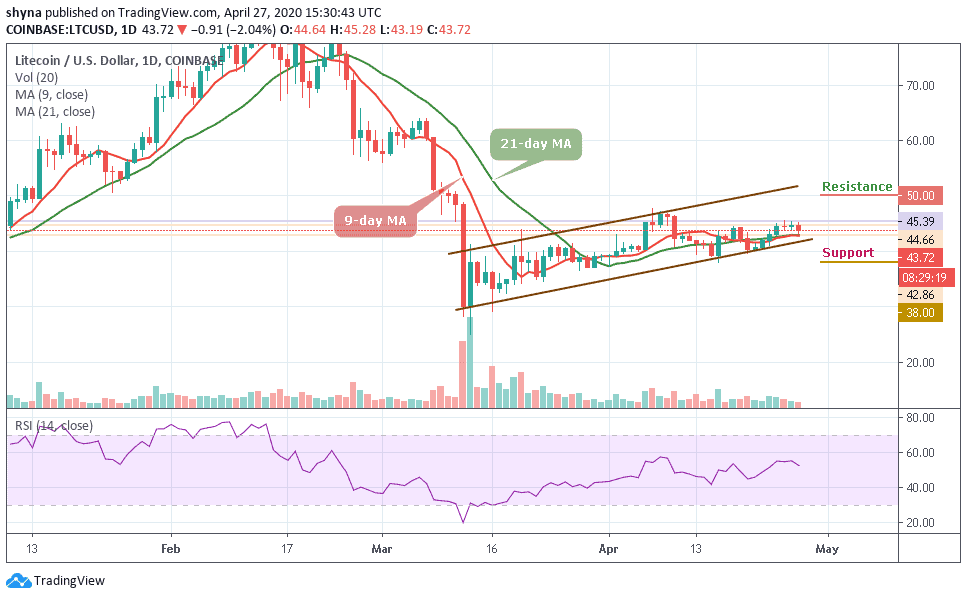
LTC/USD has been trying to withhold the bear pressure ever since the volatility crept into the crypto market today. The Litecoin price has been trying to maintain its price momentum in the upward range and has even succeeded to a certain extent with the price fluctuating in the range between $43 and $45. However, LTC/USD pair is characterized by small candlesticks that describe the indecision between buyers and sellers.
Moreover, the price movement on a daily bases is insignificant. For instance, the price movement in the previous weeks has been on a sideways movement, from $46 to $38. The market has been ranging, what we are expecting the bulls and bears is to push the price upward or downward. That is, the coin may either stay above or below the 9-day and 21-day moving averages to know the direction of the market.
Meanwhile, the Litecoin price is facing the south trading around the 53-level zone of the daily stochastic. This implies that the coin may soon experience a strong bearish momentum. The resistance levels to watch are $50, $52, and $54 while that of supports is $38, $36, and $34 respectively.
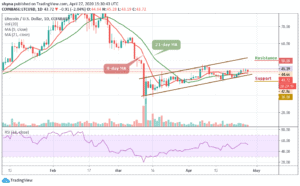
Comparing with BTC, when we look at the price movement, we can see that Litecoin is significantly bearish on the daily price chart. Now that the price is falling, the sellers are posing more threat to the 5687 SAT support level where the nearest target lies. However, an eventual break may lead to the collapse of Litecoin.

However, a further bearish continuation may likely meet the major support at 5300 SAT before falling to 5200 SAT and 5100 SAT while the buyers may likely push the market to the potential resistance at 6100 SAT, 6200 SAT and 6300 SAT respectively. The RSI (14) has crossed below the 40-level. LTC will continue to drop if the sellers continue to release the pressure.
Please note: Insidebitcoins.com is not a financial advisor. Do your research before investing your funds in any financial asset or presented product or event. We are not responsible for your investing results.
Join Our Telegram channel to stay up to date on breaking news coverage
