Join Our Telegram channel to stay up to date on breaking news coverage
LTC Price Prediction – November 21
The price of Litecoin stays under bearish pressure following a strong sell-off from November 10 high.
LTC/USD Market
Key Levels:
Resistance levels: $58, $60, $62
Support levels: $50, $48, $46
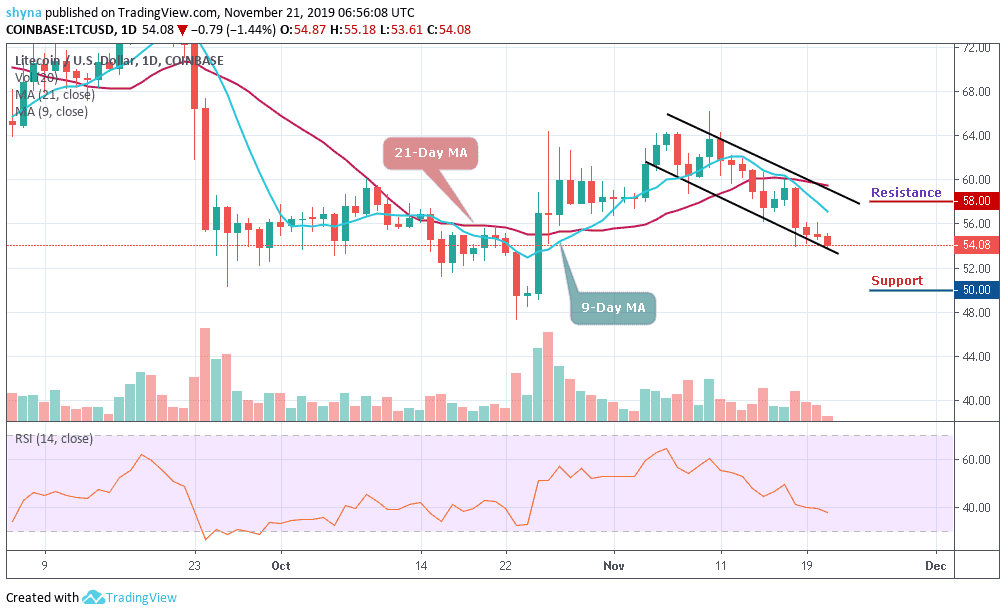
At the time of writing, LTC/USD is changing hands at $54.08 and it is nursing losses with a sharp drop from levels around $59.31 to lows almost risking breaking $54. Looking technically, a sustainable move below $59 handle bodes ill for Litecoin bulls. If the buyers failed to push the price back above this barrier, the downside pressure is likely to increase.
Looking at the chart, it can be seen that the Litecoin could not exceed the $56 level at the moment and had fallen to a support level of $54. The price tried to recover from here touching $55.14 before retesting again, but will need to struggle to make an upward movement above the 9-day moving average before reaching the 21-day MA. If the bulls can achieve this, the resistance level to be visited could be $58, $60 and $62.
Nevertheless, on the downside, LTC/USD is supported by psychological $53. Once it is out of the way, after crossing below the lower boundary of the channel, the sell-off is likely to gain traction with the next focus on the recent daily low of $50. The next bearish target awaits us on approach to $48 and $46 support levels as the RSI (14) moves below the 40-level which may likely reach the oversold territory.
When compared with Bitcoin, Litecoin price has continued to follow a bearish sentiment for over a week as the coin suffers a serious downtrend pressure from Bitcoin. If the bulls attempt to gain momentum, the bears are likely to keep releasing a huge pressure on the market. LTC passed the resistance level of 6970 SAT and found demand around the 6639 SAT level.
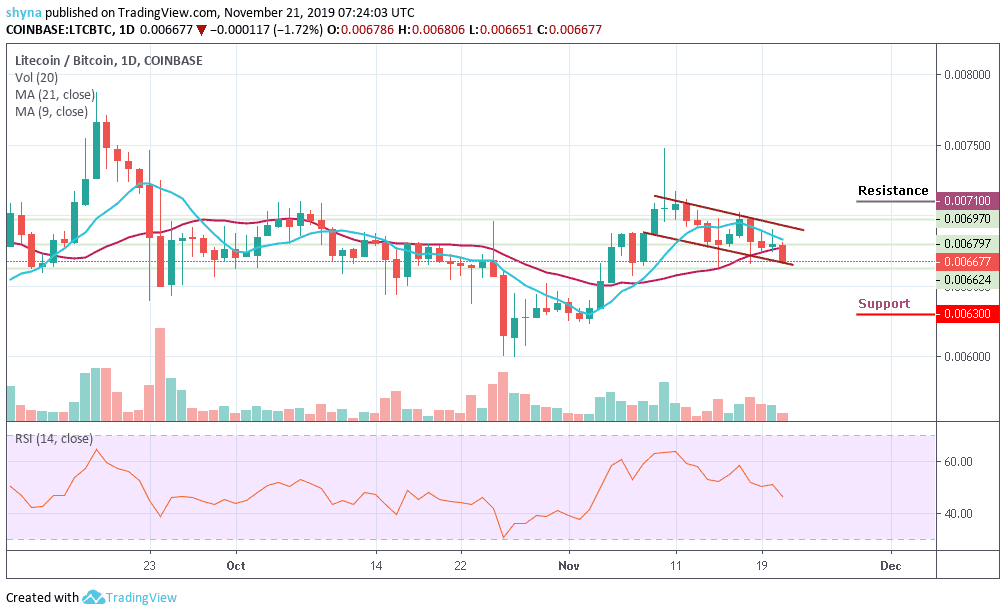
Looking at the chart, the closest resistance level is now at 7100 SAT and above. From below, the nearest level of support is 6500 SAT. Below this, additional support is found at 6300 SAT and 6100 SAT. Meanwhile, the RSI (14) signal line has nosedive below the 50-level, giving bearish signals, which may suggest that the recent recession could probably continue to fall.
Please note: Insidebitcoins.com is not a financial advisor. Do your research before investing your funds in any financial asset or presented product or event. We are not responsible for your investing results.
Join Our Telegram channel to stay up to date on breaking news coverage