Join Our Telegram channel to stay up to date on breaking news coverage
LTC Price Prediction – June 25
The Litecoin price maintains its position despite volatility as the bulls defend the support at $41.
LTC/USD Market
Key Levels:
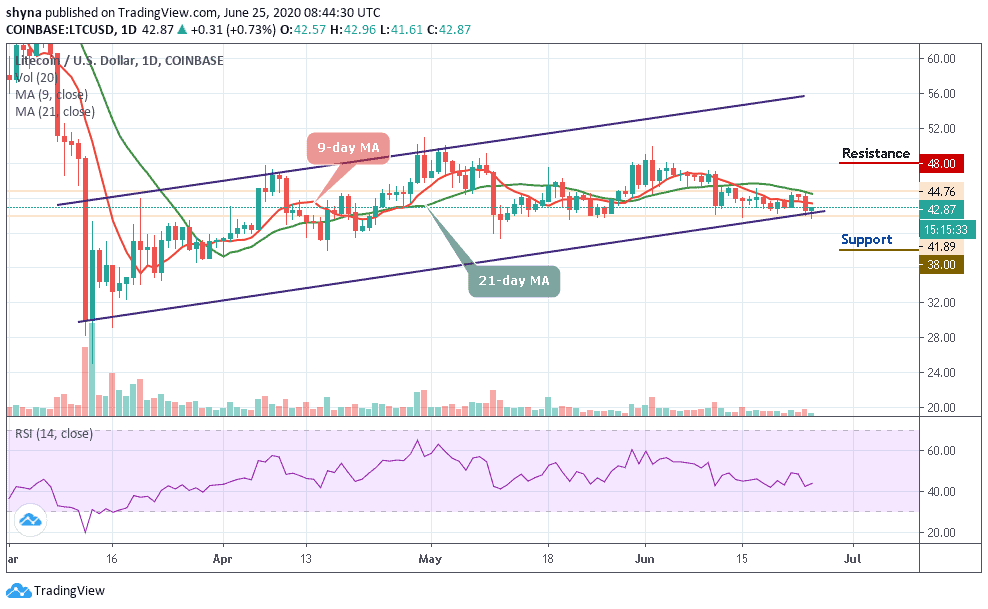
Resistance levels: $48, $50, $52
Support levels: $38, $36, $34
The intraday movement of LTC/USD is not that impressive enough but if the coin improves in the last hours of the day, the intraday traders may expect a positive close. At present, most of the top cryptocurrencies are under tremendous selling pressure. Nevertheless, traders hope for improvement, but it may take some time.
A few days ago, LTC/USD started with a trading price of about $43.74 and closed the day with $44.30. Today, the market opened with a little rise after which the bears grabbed the price and dragged it below the point where it started trading a few days ago. With this fall, the coin might not be able to maintain its effectiveness before showing some signs of downward trends.
Nevertheless, the intraday movement of the coin is quite unstable, but starting at $41.54, a rebound may likely occur, and if the bulls can put more effort to push the Litecoin price to cross above the 9-day and 21-day moving averages. The potential resistances to watch are $48, $50, and $52 while the supports are $38, $36, and $34 as the stochastic RSI nosedives below 40-level.
Comparing LTC with BTC, we can easily see that the pair is breaking below the 9-day and 21-day moving averages from the daily high of 4644 SAT. Litecoin price could see another sharp drop if it crosses below the channel. Breaking this barrier could further take the price to the critical support levels at 4350 SAT and 4250 SAT.
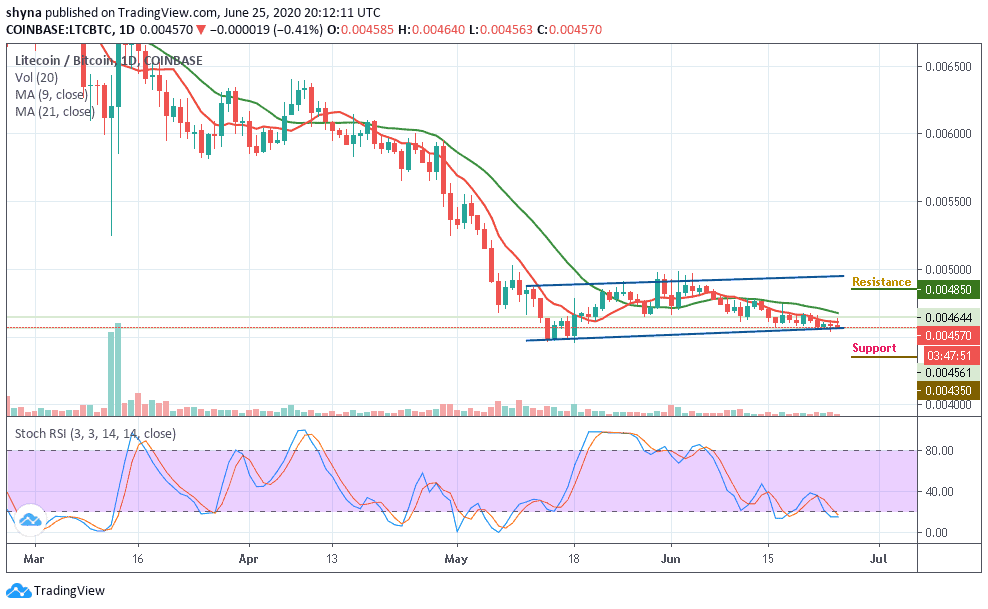
However, the Litecoin price is trading at 4570 SAT level, if the bulls can hold the price as it is and move the market upward, the next key resistance levels lie at 4700 SAT respectively. Reaching these levels might take it to the potential resistance levels of 4850 SAT and 4950 SAT. Meanwhile, the stochastic RSI is seen moving into the oversold zone, indicating a bearish movement for LTC/BTC.
Join Our Telegram channel to stay up to date on breaking news coverage