Join Our Telegram channel to stay up to date on breaking news coverage
LTC Price Prediction – August 16
The Litecoin price is currently changing hands at $61.48. The RSI (14) indicator moves around 65-level.
LTC/USD Market
Key Levels:
Resistance levels: $70, $72, $74
Support levels: $50, $48, $46
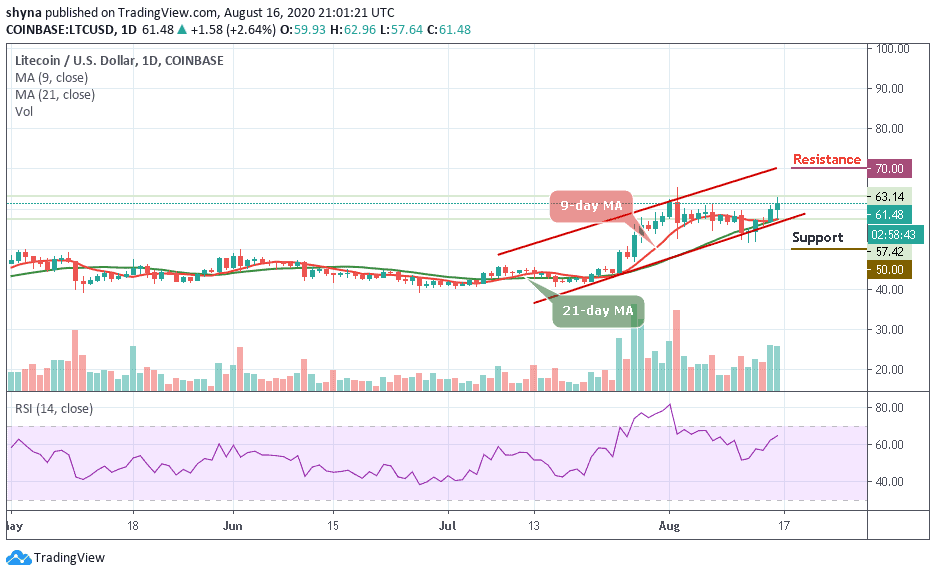
LTC/USD is currently trading at around $46. Once it manages to surpass the current resistance of $61.48, the next target is at $65 if it pushes higher. Nevertheless, a breach from here may bring the price to around $58 as the last 48-hours surge is supported at $55 support level. Therefore, if this level fails to hold strong, the price could slip back below the 9-day and 21-day moving averages at $52.
What to Expect from Litecoin (LTC)
Looking at the current market sentiment, the bulls are now gaining control of the market. Moreover, if the bulls can put more effort and push the market towards the upper boundary of the channel, then the market price may hit the resistance levels of $70, $72, and $74 respectively. More so, any movement above these key resistance levels should, therefore, encourage further buying.
Nevertheless, a break below the lower boundary of the channel may provoke an even deeper decline towards the $50, $48, and $46 support levels. Meanwhile, the technical indicator RSI (14) reveals that the Litecoin may exhibit the tendencies to follow an upward trend as the signal line moves towards the 70-level which may cause the market to remain stable above the average.
Against Bitcoin, LTC is making an attempt to cross the upper boundary of the channel in other to reach the resistance at 5400 SAT. Unless this resistance is effectively exceeded and the price ends up closing above it, there might not be any reason to expect the long-term bullish reversal.
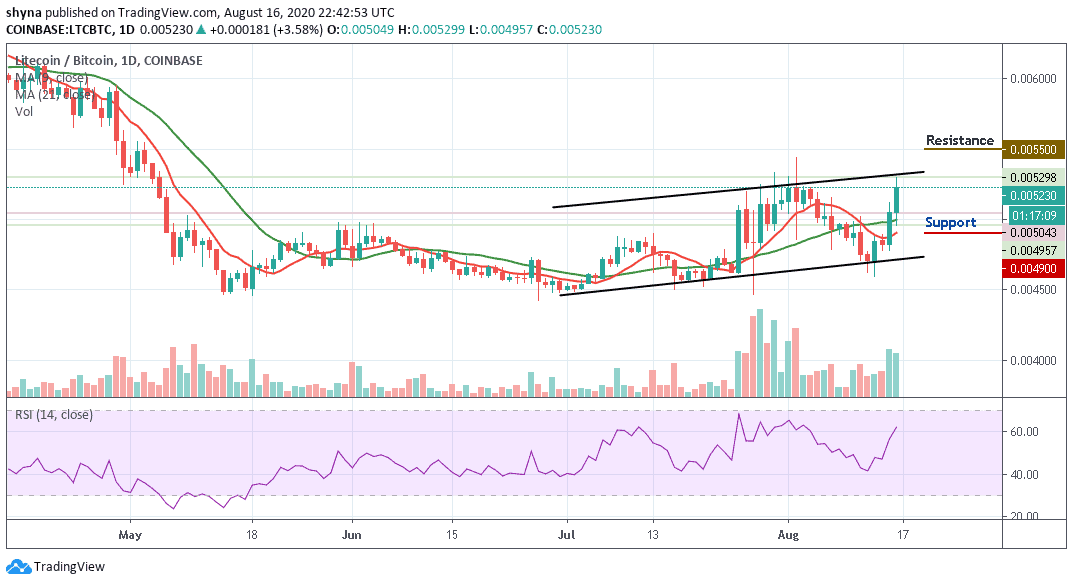
On the contrary, trading below the 21-day MA could refresh low under 5000 SAT and a possible bearish continuation may likely meet the major support at 4900 SAT and below while the buyers may push the coin to the potential resistance at 5500 SAT and above. In addition, the RSI (14) crosses above the 60-level to give more bullish signals.
Join Our Telegram channel to stay up to date on breaking news coverage