Join Our Telegram channel to stay up to date on breaking news coverage
LTC Price Prediction – January 4
Litecoin market witnesses a drop today, amounting to a 4% loss with a current trading price around $155.
LTC/USD Market
Key Levels:
Resistance levels: $185, $190, $195
Support levels: $125, $120, $115

According to the daily chart, LTC/USD is currently changing hands at $155.06, down with 4% loss. The coin is now recovering from the intraday low of$140, but the upside momentum is quite slow. However, if the market reclaims the positive momentum, the Litecoin price would continue to respect the channel pattern. Otherwise, more breakdowns may likely play out in the market.
What to Expect from Litecoin (LTC)
The Litecoin (LTC) is seen trading above the 9-day and 21-day moving averages. Therefore, a possible retracement below the moving averages may drag the price to the supports level of $125, $120, and $115 supports, creating a new monthly and yearly low. But if bulls decide to move the market price upward, buying pressure may experience further bullish movements to the potential resistance at the $175 and $180.
Meanwhile, as it appeared now, there’s a need for a pullback for the market to regain strength. A sustainable move above the upper boundary of the channel is needed for the upside to gain traction with the next focus on $185, $190, and $195 resistance levels.
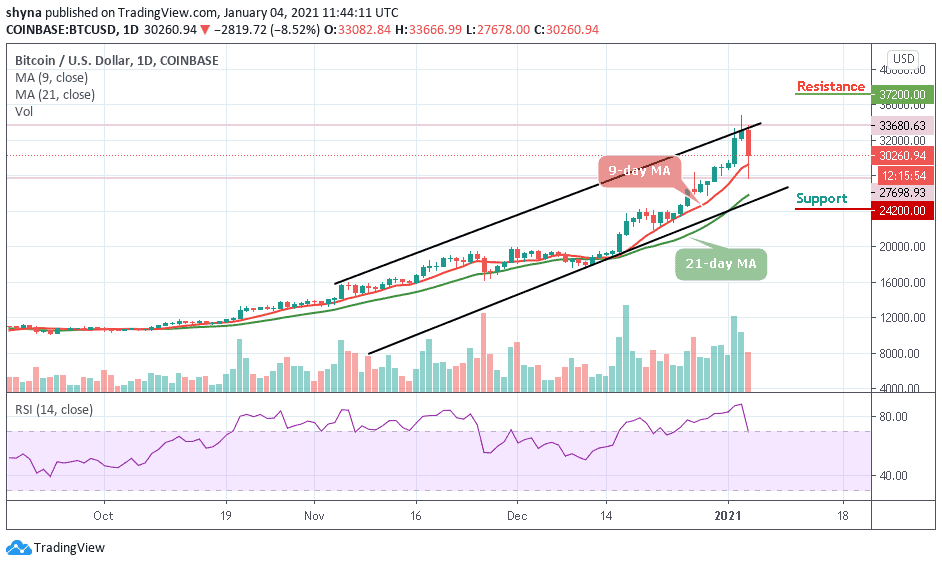
When compares with Bitcoin, the Litecoin price is following a bearish sentiment now as the coin suffers a slight downtrend pressure from Bitcoin. However, if the bulls attempt to gain momentum, the bears are likely to keep releasing a huge pressure on the market as the technical indicator RSI (14) may head to the south.
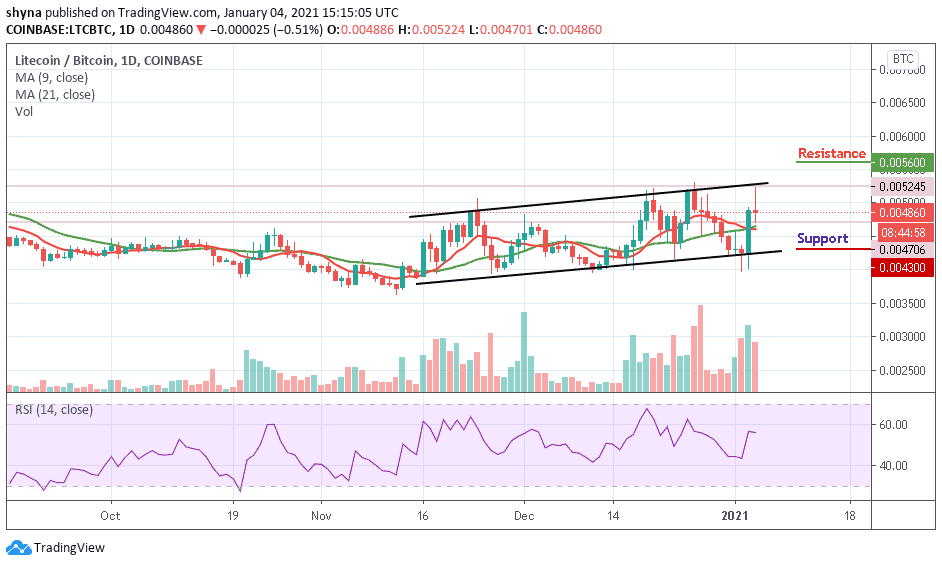
Moreover, if the Litecoin falls below the 9-day and 21-day moving averages, it could significantly lower the price to 4300 SAT and below. In case of a rebound, the coin can test the 5400 SAT above the channel before resuming the rally. If the bulls manage to stay well above this level, traders could see a bull-run to the resistance level of 5600 and above.
Join Our Telegram channel to stay up to date on breaking news coverage