Join Our Telegram channel to stay up to date on breaking news coverage
LTC Price Prediction – July 9
Today, LTC/USD is seen moving downward after falling from its range amid strong bearish sentiments.
LTC/USD Market
Key Levels:
Resistance levels: $50, $52, $54
Support levels: $40, $38, $36

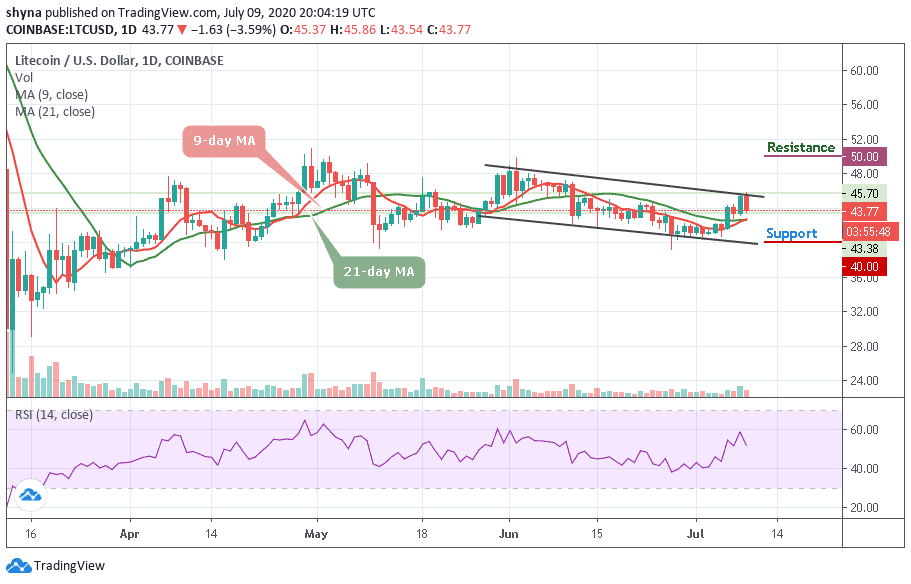
At market opening today, after touching the daily high at $45.70, LTC/USD price is seen following a bearish movement towards the 9-day and 21-day moving averages. On the upside, the market movement still remained under $48. Locking operations in the last 3 weeks were dull and offered little trading activities. Despite this, the broken support of the price shows the formation of a lower low trend which gave an indication that the bears were largely under control.
Meanwhile, LTC/USD could not avoid the bearish wave that ranged the market on June 11 and June 27. However, this painful downward trend exerted intense pressure on key support established above $45. More so, the declines devastated the support zone and pushed the coin below $40.
At the moment, the crypto is currently trading at $43.77 after losing 3.59% of its value. The RSI (14) is heading below 55-level, which shows that an immense bearish pressure may continue to weigh on the support at $42 if it crosses below the 50-level. The market may witness further declines at support levels of $40, $38, and $36. Meanwhile, if the current price level can be maintained, traders could see a buyback with $48 resistance before getting to the resistance levels of $50, $52, and $54.
Pairing it with Bitcoin, Litecoin (LTC) is moving on sideways within the channel since May 14 and the price is currently trading at 4768 SAT above the 9-day and 21-day moving averages. With volume accumulating on the price chart, the price may likely fall to 4500 SAT before reaching the 4400 SAT and 4300 SAT support levels.

However, the RSI (14) indicator is seen moving down from 60-level, which indicates a downward trend. Moreover, for LTC/BTC to increase and move towards the resistance levels of 4900 SAT and 5000 SAT, the RSI indicator will need to go above the 60-level to show that the re-occurrence of the bulls back into the market.
Join Our Telegram channel to stay up to date on breaking news coverage

