Join Our Telegram channel to stay up to date on breaking news coverage
Litecoin Price Prediction – January 17
The Litecoin price prediction gains 2.42% in the last 24 hours to touch the daily high at $153 s it may find the next resistance at $160.
LTC/USD Market
Key Levels:
Resistance levels: $182, $192, $202
Support levels: $112, $102, $92

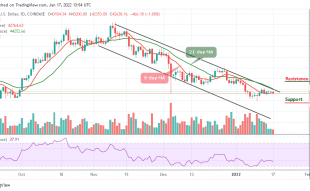
LTC/USD has been exhibiting strength over the last 24 hours but manages to regain above the 9-day and 21-day moving averages amid technical correction from the downward trend. Now, the coin is recovering towards resistance level of $155. More so, if the red-line of the 9-day MA crosses above the green-line of the 21-day MA, the Litecoin price may continue the bullish movement.
Litecoin Price Prediction: Litecoin (LTC) Finally Making A Bounce?
Looking at the daily chart, the Litecoin price keeps moving to the north. Moreover, though the current price of Litecoin at $150.44 is above the 9-day moving averages and 21-day moving averages within the channel, the recovery seems to have begun as the technical indicator RSI (14) faces the north. The Litecoin (LTC) needs to continue its up-trending growth in the coming days to recover properly. As per the current trend, the next resistance level is likely to come at $182, $192, and $202.
On the downside, a sustainable move below the moving averages could open the bearish way to a $130 support level and this barrier may likely slow down the bears and then serve as a jumping-off ground for the recovery. Meanwhile, the next support levels could be located at $112, $102, and $92 respectively.
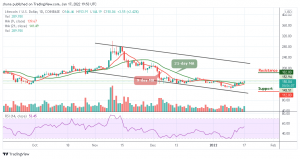
Against Bitcoin, the Litecoin price continues to trend bullishly as the resistance further outweighs the support. However, there is a need for an increasing volume and resistance to cause an upsurge in the market which could make the coin to cross above the upper boundary of the channel and move towards the resistance level of 3900 SAT and above.
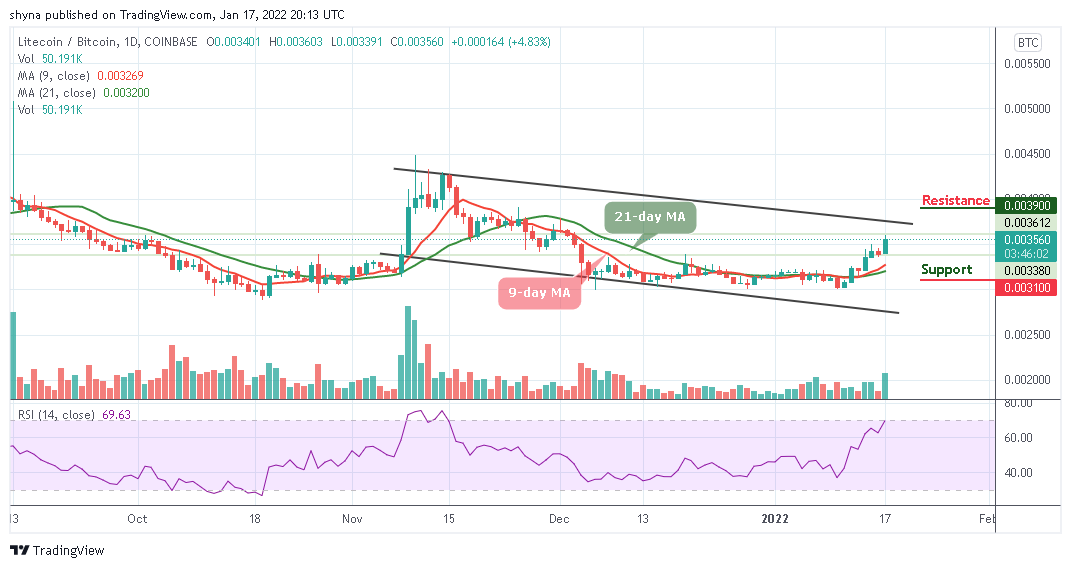
However, there’s no sign of a bearish movement in the market at the time of writing. Therefore, if a bearish move occurs and bring the coin below the 9-day and 21-day moving average, LTC/BTC may hit the nearest support at 3100 SAT and below but the technical indicator Relative Strength Index (14) is seen moving into the overbought region to increase the bullish movement.
Looking to buy or trade Litecoin (LTC) now? Invest at eToro!
68% of retail investor accounts lose money when trading CFDs with this provider
Join Our Telegram channel to stay up to date on breaking news coverage