Join Our Telegram channel to stay up to date on breaking news coverage
Bitcoin Price Prediction – January 17
The Bitcoin price prediction is now showing signs of market correction as its price moves below $43,000 to touch the low of $42,353.
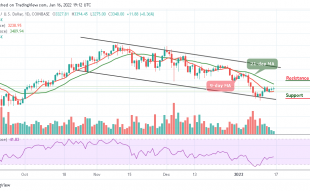
BTC/USD Long-term Trend: Bearish (Daily Chart)
Key levels:
Resistance Levels: $47,000, $49,000, $51,000
Support Levels: $39,000, $37,000, $35,000
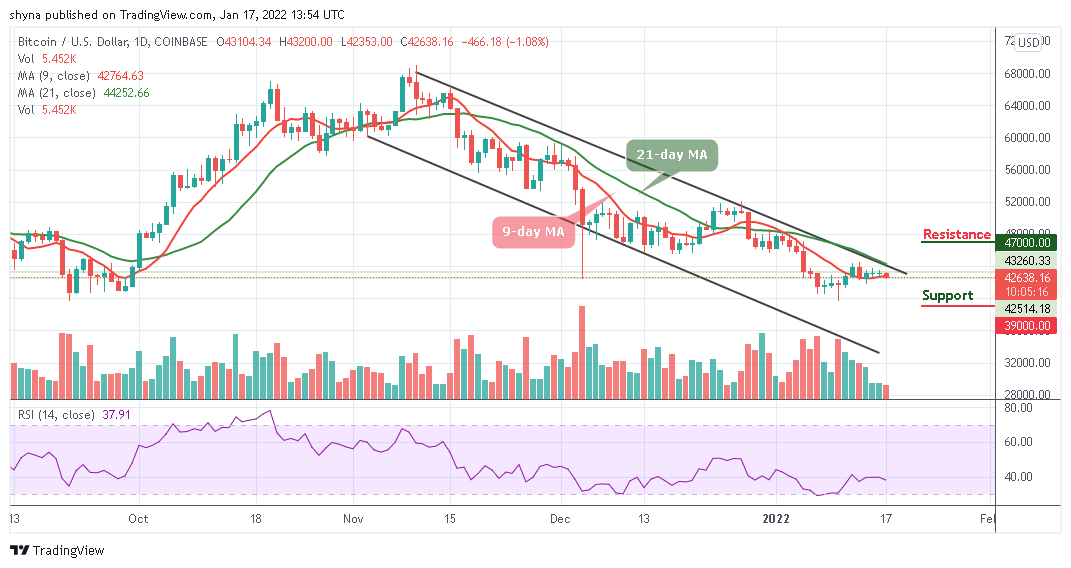
BTC/USD is currently trading below the $43,000 level as the price is likely to cross below the 9-day moving average. However, the consolidation could be coming to an end according to the technical indicator which indicates that the king coin might likely drop more on its way to the lower boundary of the channel.
Bitcoin Price Prediction: Bitcoin (BTC) Ready to Flash More Bearish Signals
Presently, the Bitcoin price is changing hands at $42,638, which could still mark a significant rally below the 9-day moving average. However, where BTC trends next may depend on whether sellers can close today’s candle below the $43,000 level. However, should in case this comes to play, it may propel prices lower. Meanwhile, looking at the daily chart, traders expect BTC/USD to fall below $42,000 support which could later move towards the critical support levels at $39,000, $37,000, and $35,000.
On the other hand, if the Bitcoin price failed to close below the $42,000 level; the price may cross above the 9-day moving average, and any other bullish movement may lead the coin to the 21-day moving average. Nevertheless, crossing above the upper boundary of the channel may send the price to $47,000, $49,000, and $51,000 resistance levels. Now, the technical indicator Relative Strength Index (14) recently reveals a sign of trend reversal, which shows a possible bearish momentum is coming in the market soon.
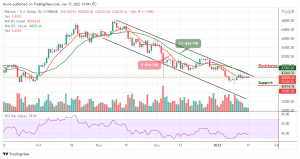
BTC/USD Medium – Term Trend: Ranging (4H Chart)
On the 4-hour chart, BTC/USD is currently trading around $42,142 below the 9-day and 21-day moving averages after touching the resistance level of $42,552 as the Bitcoin price heads to the south.
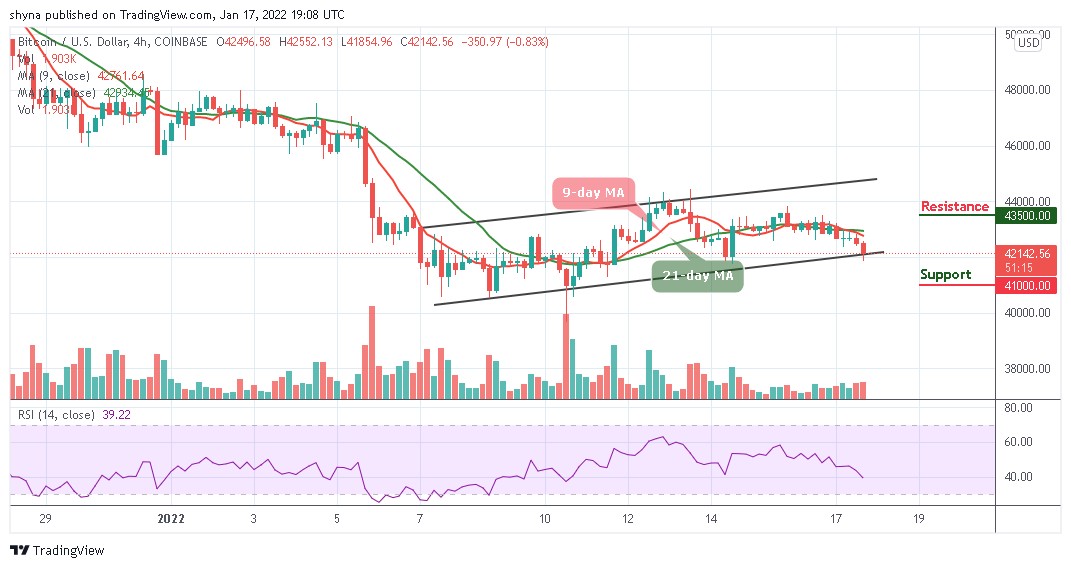
However, if the buyers could energize the market, they can push the price above the 9-day and 21-day moving averages and this could push the market price towards the resistance level of $43,500 and above. Meanwhile, the technical indicator Relative Strength Index (14) is likely to cross below 40-level, but any further bearish movement could reach the support level of $41,000 and below.
Looking to buy or trade Bitcoin (BTC) now? Invest at eToro!
68% of retail investor accounts lose money when trading CFDs with this provider
Read more:
- How to buy Bitcoin
- How to buy Cryptocurrency
Join Our Telegram channel to stay up to date on breaking news coverage