Join Our Telegram channel to stay up to date on breaking news coverage
LTC Price Prediction – June 11
The price of Litecoin (LTC) is currently moving towards the south as the coin falls from its range. It is now trading in the downward, with a loss of 6.47% within 24 hours.
LTC/USD Market
Key Levels:
Resistance levels: $50, $54, $56
Support levels: $40, $38, $36

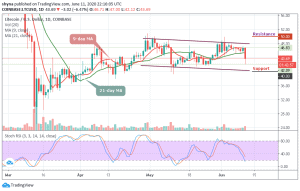
At the opening of the market today, the LTC/USD price was seen following a bullish movement above the 9-day and 21-day moving averages at $47.10. Meanwhile, LTC/USD could not avoid the bearish wave that ranged the market today. This painful downward trend exerted intense pressure on key support established below $45. More so, the declines devastated the support zone and pushed the coin to touch the low of $42.09.
Looking at the daily chart, we can see that LTC is still sitting at $43.69. If the price level can be maintained, we could consider a buyback with $45 resistance before breaking above the 9-day and 21-day moving averages to reach the resistance levels of $50, $52, and $54. But as it stands now, the bears are making an attempt to visit close supports before climbing higher.
Moreover, the Litecoin is still following the downtrend within the channel formation, and this shows that the market is still bearish. If the price moves below the lower boundary of the channel, which corresponds to the support at $42, we can expect the LTC market to continue its downward pressure and the price could slip to the critical supports at $40, $38 and $36 respectively as the stochastic RSI moves into the oversold zone, confirming the downward market dynamics.
Meanwhile, when compared with Bitcoin, Litecoin price is making an attempt to cross above the 9-day and 21-day moving averages in other to reach the resistance at 5000 SAT. Unless this resistance is effectively exceeded and the price ends up closing above it, there might not be any reason to expect the long-term bullish reversal.
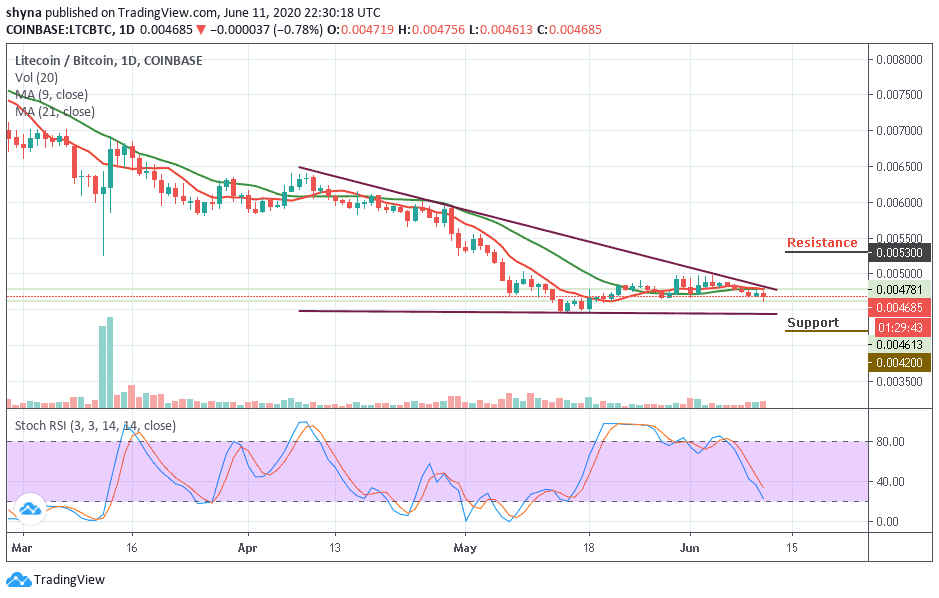
However, trading below the moving averages could refresh lows under 4500 SAT and a possible bearish continuation may likely meet the major support at 4300 SAT before falling to 4200 SAT and below while the buyers may push the coin to the potential resistance at 5300 SAT and above. Meanwhile, the stochastic RSI moves toward the oversold zone to give more bearish signals.
Please note: Insidebitcoins.com is not a financial advisor. Do your research before investing your funds in any financial asset or presented product or event. We are not responsible for your investing results.
Join Our Telegram channel to stay up to date on breaking news coverage