Join Our Telegram channel to stay up to date on breaking news coverage
LTC Price Prediction – April 25
In the course of the current LTC/USD reversal movements, price has gotten lowered down to touch the support of $200 on April 23 trading session.
LTC/USD Market
Key Levels:
Resistance levels: $260, $280, $320
Support levels: $180, $160, $140
LTC/USD – Daily Chart
There has now been a touch of a lower support line of around $200 mark on the LTC/USD daily trading chart to now suggest a strong re-launching of an upswing in this market operation in the near time. The formation of serial bearish candlesticks denoting the rein of price reversal pattern has supposedly achieved its lowest point to have a stop around the bigger SMA indicator. The 14-day SMA trend-line is situated over the 50-day SMA. And, the Stochastic Oscillators are dipped into the oversold region with conjoined hairs pointing to the east in it. That suggests an indecision trading moment of the crypto-economy.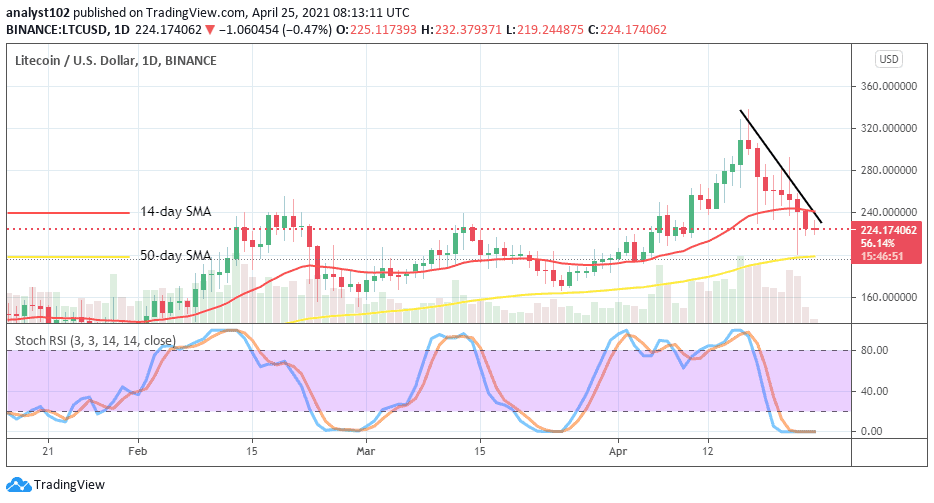
Will the LTC/USD market be able to pull-up back sustainably above the $240 point?
By large and small, the LTC/USD market’s level of $240 will now have to play a vital role in determining a new change of direction for this crypto-market. The point of around $200, will most likely witness a line of price revisits should bull slightly lose in strength for a while under the higher level of $240. It is equally expected of bulls to be on the lookout for a resurface of a buy signaling candlestick around that area to be able to have a decent idea to enter a buy order in the market.
On the downside, bear’s chance of taking this trade further downwards has seemed to be fully utilized. However, price still trades in the lower zone as there can be more rooms in consolidation moving bid by the bears to take the market line more downward by breaking the support of $200. In the event of that assumption coming to play out, traders need to be as well cautious of fake breakdown in the end.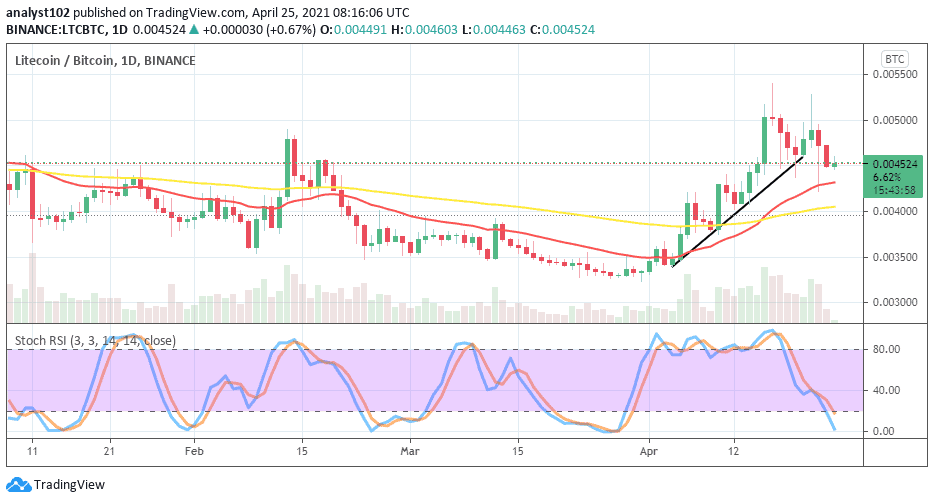
LTC/BTC Price Analysis
Over a couple of sessions, the financial book of records still shows that the purchasing strength between LTC and BTC gives it to the former trading instrument as having a stronger weight. That said, BTC as the counter crypto has now on a struggling note been pushing against the uptrend from a high point in the market. The 14-day SMA trend-line is located above the 50-day SMA indicator. And, they are underneath the trading point of the crypto pair. The stochastic Oscillators are more slantingly traveled from the overbought region to have a light dip into the oversold region. That signals the possibility of seeing less-actions in the performance of the counter crypto against its base trading instrument in the near time.
Join Our Telegram channel to stay up to date on breaking news coverage