Join Our Telegram channel to stay up to date on breaking news coverage
LTC Price Prediction – October 9
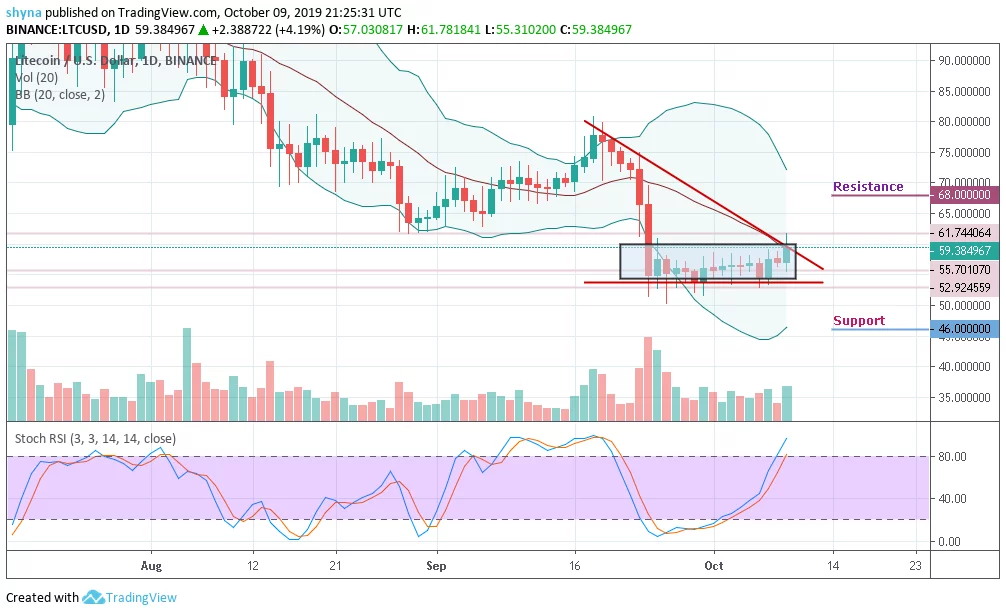
The Litecoin price is currently changing hands at $59.38. The stochastic RSI indicator moves into the overbought zone.
LTC/USD Market
Key Levels:
Resistance levels: $68, $70, $72
Support levels: $46, $44, $42

Litecoin price is trading in the green in today’s session, moving around the middle boundary of the Bollinger bands where the coin has gained over 3.10%. LTC/USD bulls broke out from a narrowing range-block formation but the price action is capped to the upside at $59 and supported the downside at $55, within tight conditions.
Furthermore, a few days ago, Litecoin (LTC) price was trapped in an incredibly narrow trading range after the bullish rally has failed to materialize several times. The coin has failed to clear the hurdles towards the resistance level of $60. Instead, the bears are trying to force their way back to the $52 support level.
However, a break below the $50 support level may provoke an even deeper decline towards the $46, $44 and $42 support levels. Looking at the stochastic (RSI), Litecoin may exhibit the tendencies to correct lower after the coin purges from the overbought zone, the indicator is struggling to remain stable at the average.
In other words, any attempt by the bulls to put more effort and push the market towards the upper boundary of Bollinger bands, then it’s likely for the price to hit the resistance levels of $68, $70 and $72 respectively. A move above these key resistance levels should, therefore, encourage further LTC/USD buying.
Meanwhile, when compared with Bitcoin, Litecoin price is making an attempt to cross the symmetric triangle in other to reach the resistance at 0.0073 BTC. Unless this resistance is effectively breached and the price ends up closing above it, there might not be any reason to expect the long-term bullish reversal.
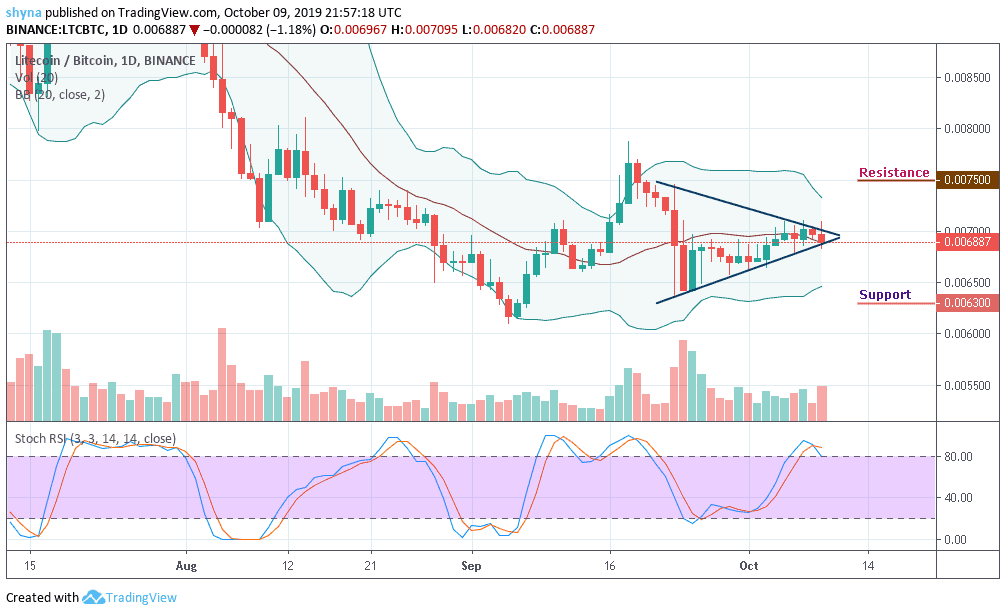
However, trading below the triangle support could refresh lows under 0.0067 BTC and a possible bearish continuation may likely meet the major support at 0.0065 BTC before falling to 0.0063 BTC and below while the buyers may push the market to the critical potential resistances at 0.0075 BTC and above. The stochastic RSI may soon be coming out of the overbought zone to start giving bearish signals.
Please note: Insidebitcoins.com is not a financial advisor. Do your research before investing your funds in any financial asset or presented product or event. We are not responsible for your investing results.
Join Our Telegram channel to stay up to date on breaking news coverage