Join Our Telegram channel to stay up to date on breaking news coverage
LTC Price Prediction – April 9
LTC/USD may likely set a bullish run if the market can climb back above the $48.
LTC/USD Market
Key Levels:
Resistance levels: $54, $56, $58
Support levels: $38, $36, $34
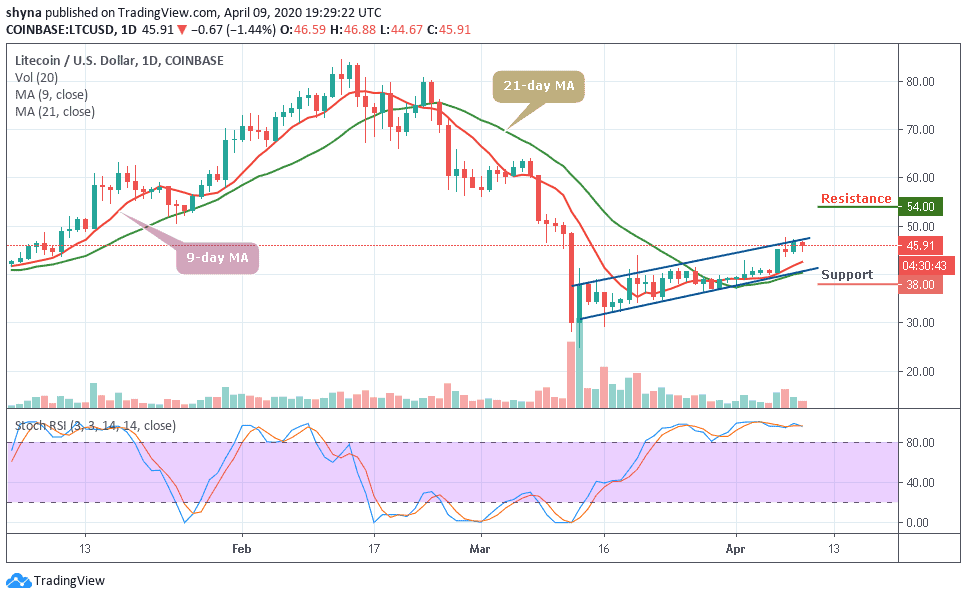
As of now, LTC/USD is showing a negative movement over the past few hours. The market is actually running a little retracement move towards $47 with a loss of 1.44%. Despite today’s loss, Litecoin (LTC) is still maintaining an upward movement within the ascending channel. We can expect the price to continue the upward trend as soon as the bulls put more pressure on the market.
Moreover, if the lower boundary breaks this time, the price may slide back to $42 and $40 support. But if the price can keep respecting the upward movement, we can then expect a bullish continuation after testing the $48 support. As the technical indicator, stochastic RSI continues to move within the overbought zone, the next level of resistance lies at $54, $56 and $58 levels in the long-term.
However, if the coin can continue to maintain the rising channel pattern for the next couple of days, we may witness a more bullish trend. But following the price formation, a bearish breakout may likely play out for this market. Meanwhile, LTC/USD still remains bearish in the short-term. Inversely, a bearish extension could roll the coin back to the long-term support at $38, $36 and $34 levels. Therefore, a continuous fall might further lead to a violent break below $32.
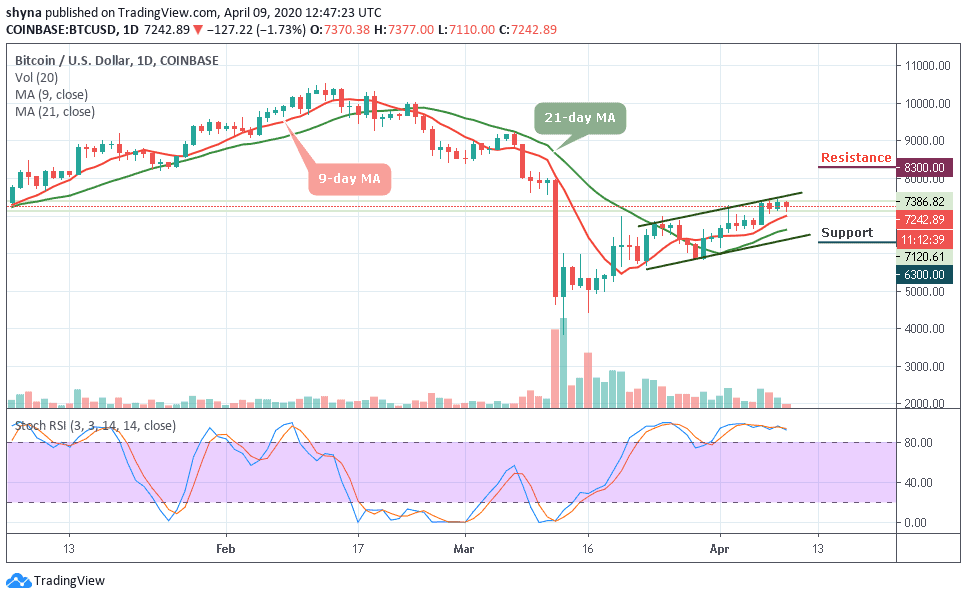
Against Bitcoin, the buyers are about stepping back into the market while the coin is trying to show some promising signs that could make higher highs should it continue to move above the 9-day and 21-day moving averages. From the upside, the nearest level of resistance lies at 6500 SAT and above this, higher resistance lies at 6700 SAT and 6900 SAT.
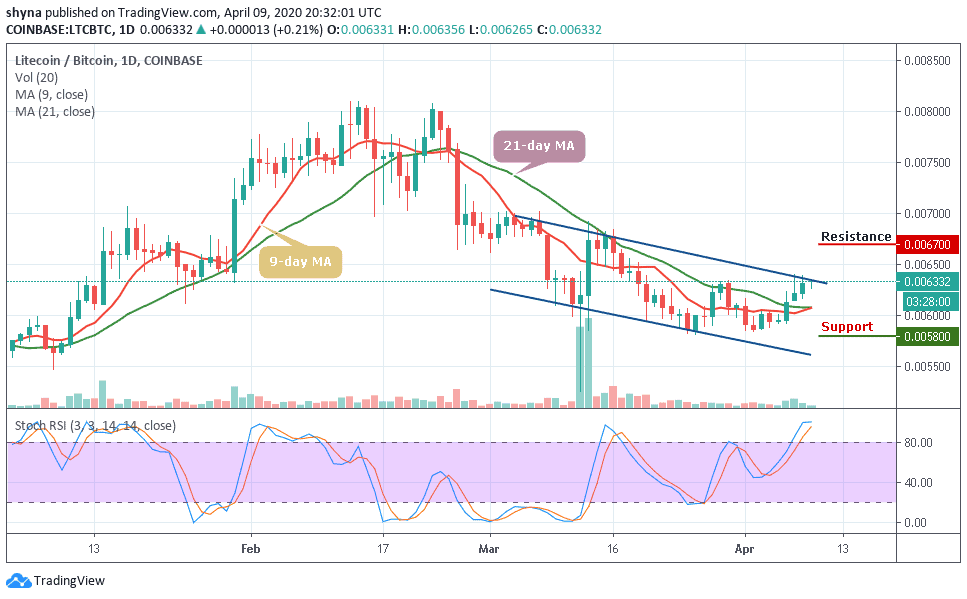
In other words, from downside; the nearest support levels are 6100 SAT and beneath this, further support lies at 5900 SAT. If the price drops further to create a new low, lower support is located at 5800 SAT and 5600 SAT. The stochastic RSI has already crossed into the overbought zone which shows that the bulls are still into focus.
Please note: Insidebitcoins.com is not a financial advisor. Do your research before investing your funds in any financial asset or presented product or event. We are not responsible for your investing results.
Join Our Telegram channel to stay up to date on breaking news coverage