Join Our Telegram channel to stay up to date on breaking news coverage
Litecoin Price Prediction – March 10
The Litecoin price prediction shows that LTC maintains its position as the coin moves to defend the support at $100.
LTC/USD Market
Key Levels:
Resistance levels: $135, $145, $155
Support levels: $70, $60, $50

LTC/USD is currently changing hands at $102.73, down with a 4.40% loss. The coin may continue to trade below the 9-day and 21-day moving averages if the technical indicator crosses below 40-level. However, if the market reclaims the positive momentum, the Litecoin price may cross above the moving averages. Otherwise, more breakdowns may likely play out in the market.
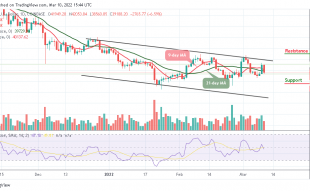
Litecoin Price Prediction: LTC Price May Head to the South
The Litecoin price is seen trading below the 9-day and 21-day moving averages and a possible retracement below this barrier may drag the price to the support levels of $70, $60, and $50, creating a new monthly low. But if bulls decide to move the market price upward, buying pressure may resume and could push the coin above the moving averages.
Moreover, the intraday movement of the coin is quite unstable as the 9-day MA sticks to the 21-day MA. However, while crossing below the 21-day moving average, a rebound might occur and if the bulls put more effort, they could push the Litecoin price towards the upper boundary of the channel. Further bullish movement could reach the resistance levels of $135, $145, and $155, but the technical indicator Relative Strength Index (14) is likely to cross below 40-level, suggesting a bearish signal.
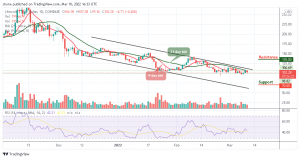
Against Bitcoin, the Litecoin price is moving around the 9-day moving average. For now, the coin is currently trading at the 2603 SAT level. At the moment, the market may continue to consolidate if the technical indicator moves in the same direction.
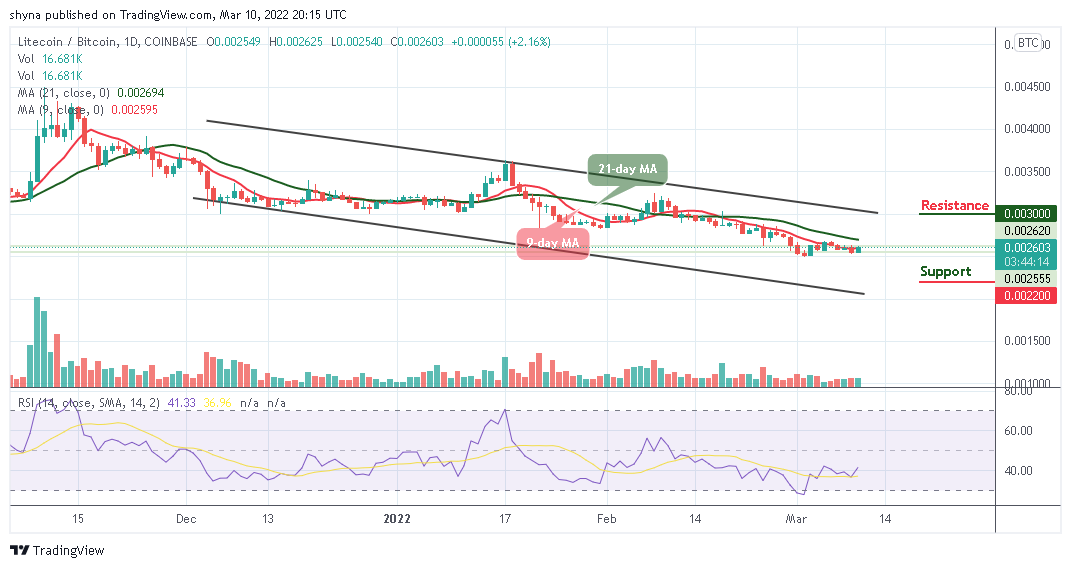
However, if the price move towards the lower boundary of the channel, the nearest key support lie at 2400 SAT, but further support could be found at 2200 SAT and below in a subsequent move. Similarly, an upward movement above the moving averages is likely to find immediate resistance at 2800 SAT, If the bulls climb above this level, higher resistance lies at 3000 SAT and above. Meanwhile, the Relative Strength Index (14) is moving above 40-level, and as it stands now, the market may move upward.
Looking to buy or trade Litecoin (LTC) now? Invest at eToro!
68% of retail investor accounts lose money when trading CFDs with this provider
Join Our Telegram channel to stay up to date on breaking news coverage