Join Our Telegram channel to stay up to date on breaking news coverage
Bitcoin Price Prediction – March 10
The Bitcoin price prediction shows that BTC slides below the moving averages as the coin touches at $38,560 support.
BTC/USD Long-term Trend: Bearish (Daily Chart)
Key levels:
Resistance Levels: $46,000, $48,000 $50,000
Support Levels: $35,000, $33,000, $31,000

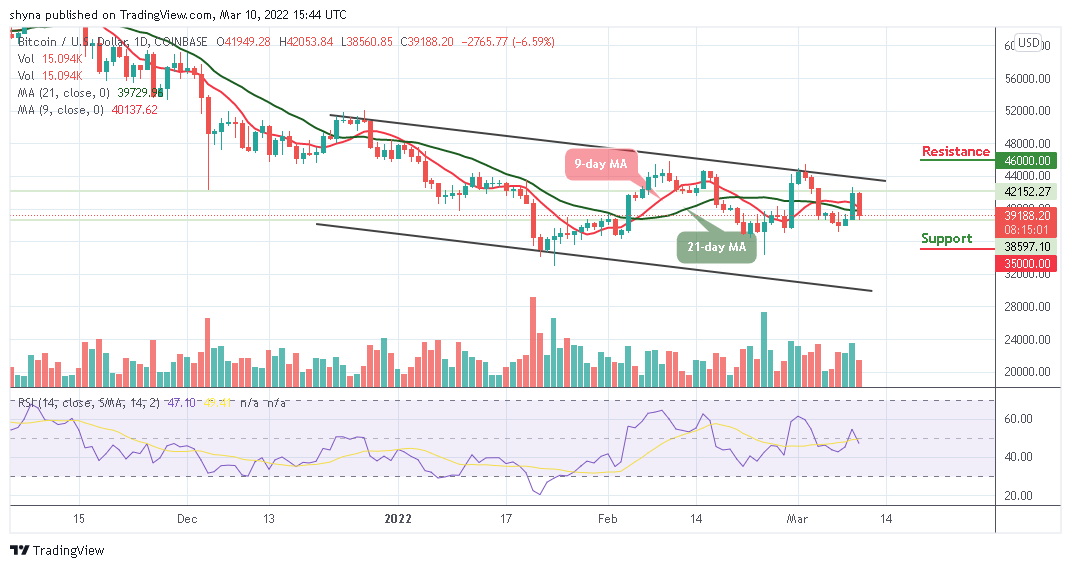
BTC/USD is facing a setback as the king coin is likely to have a bearish run in the short term as a price rally may help the coin to head to the south. Now, Bitcoin (BTC) is trading around the $39,188.20 level after a free fall from $42,053 during the European session and the coin has shown tremendous volatility over the past two days.
Bitcoin Price Prediction: Bitcoin (BTC) May Retreat Before Breaking Higher
Looking at the daily chart, the Bitcoin price is currently nose-diving below the 9-day and 21-day moving averages. If the price should slump below the support level of $38,000, the king coin is likely to face additional downward trends. However, the further bearish movement could locate the supports at $35,000, $33,000, and $31,000, making room for BTC to fall even further.
In the meantime, the technical indicator Relative Strength Index (14) is crossing below 50-level as trading volume be in support of the bears. On the contrary, if the bulls decide to move the price above the moving averages, BTC/USD may likely cross above the upper boundary of the channel to locate the resistance levels at $46,000, $48,000, and $50,000.
BTC/USD Medium-Term Trend: Ranging (4H Chart)
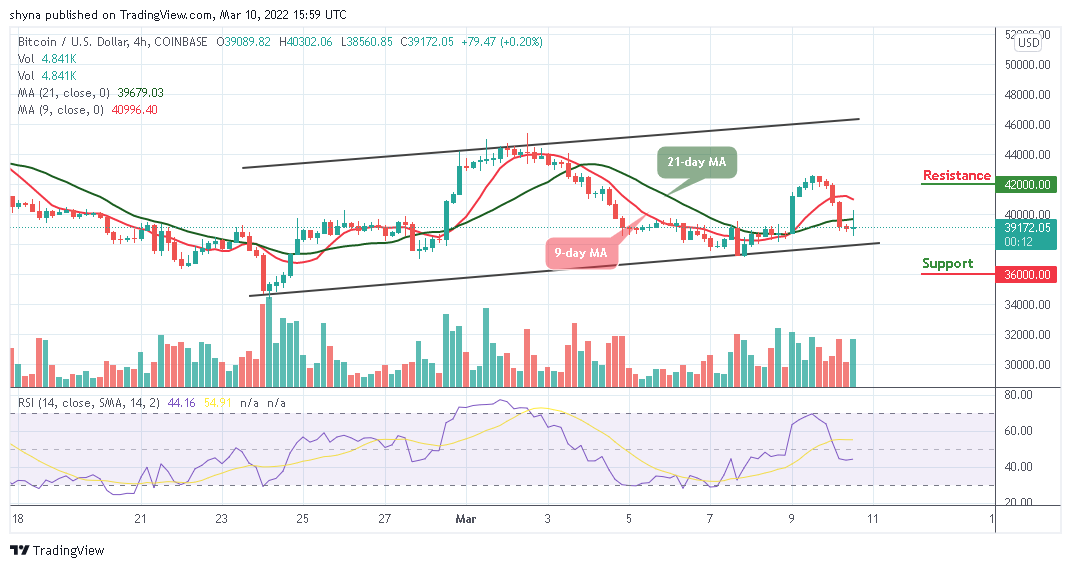
On the 4-hour chart, the Bitcoin price stays below the 9-day and 21-day moving averages, and the immediate support is likely to come at the $38,000 level. The price may likely fall below this level if the bears fully stepped back into the market.

Moreover, a further bearish movement could test the critical support at the $36,000 level and below while the resistance could be located above the moving averages at the resistance level of $42,000 and above. Technically, Bitcoin is currently moving into the negative side as the technical indicator Relative Strength Index (14) is likely to cross below 40-level.
Looking to buy or trade Bitcoin (BTC) now? Invest at eToro!
68% of retail investor accounts lose money when trading CFDs with this provider
Read more:
Join Our Telegram channel to stay up to date on breaking news coverage

