Join Our Telegram channel to stay up to date on breaking news coverage
Litecoin (LTC) Price Analysis – July 10
Litecoin absorbs losses with a sharp drop from the $120 level. All technical levels have become negative in the face of increased volatility of the crypto.
LTC/USD Market
Key Levels:
Resistance levels: $150, $160, $170
Support levels: $80, $70, $60

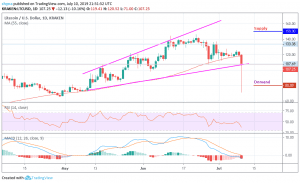
Litecoin is nursing losses with a sharp drop from levels around $120 to lows almost risking breaking $80. Looking technically, a sustainable move below $120 handle bodes ill for Litecoin bulls. If they failed to push the price back above this barrier, the downside pressure is likely to increase.
Looking at the chart, it can be seen that the Litecoin could not exceed the $140 level at the moment and had fallen to a support level of $130. The price then recovered from here, but still struggles to make any movement above the resistance at $140. If the price goes up a bit, the resistance level could be $150, $160 and $170. On the downside, the seller can find support at $80, $70 and $60.
LTC/BTC Market
Litecoin price has continued to follow a bearish sentiment for over a week as the coin suffers a serious downtrend pressure from Bitcoin. If the bulls attempt to gain momentum, the bears are likely to keep releasing a huge pressure on the market. LTC passed the supply level of 0.010BTC and found demand around the 0.0088BTC level.
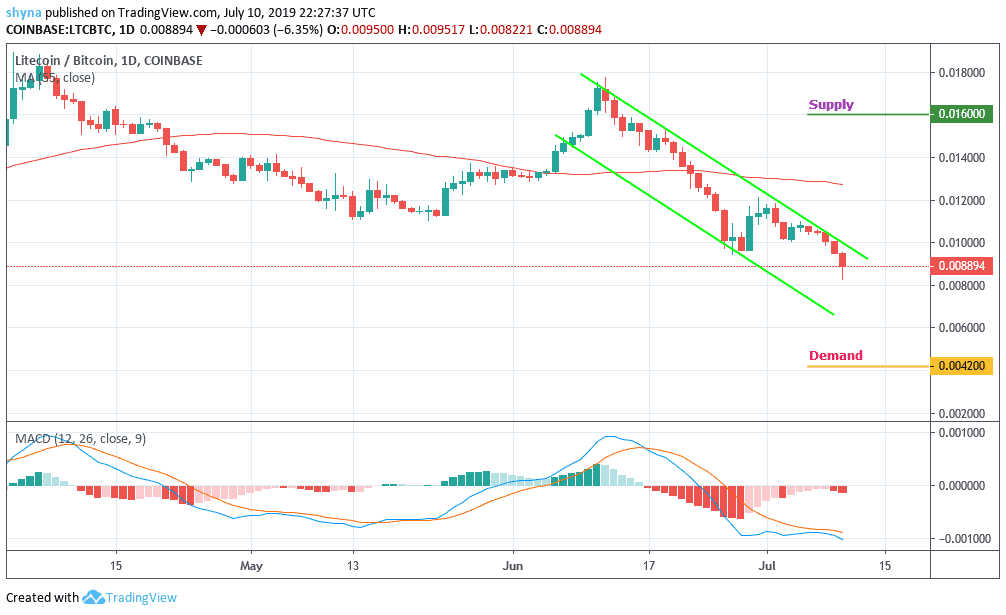
If you look at the chart, the closest supply level is now at 0.016BTC and above. From below, the nearest level of demand is 0.004BTC. Below this, additional demand is found at 0.003BTC and 0.002BTC. The MACD signal lines crossed the negative side, giving bearish signals, which may suggest that the recent recession could probably continue to fall.
Please note: insidebitcoins.com is not a financial advisor. Do your own research before investing your funds in any financial asset or presented product or event. We are not responsible for your investing results.
Join Our Telegram channel to stay up to date on breaking news coverage