Join Our Telegram channel to stay up to date on breaking news coverage
Litecoin (LTC) Price Prediction – December 10, 2020
LTC/USD has been trading below the $90 resistance as bulls fail to break the overhead resistance. The coin is correcting downward and perhaps for a possible upward move. In the meantime, the coin is trading at $75 at the time of writing. Similarly, LTC/BTC is in a downtrend. After its recent breakdown to Ƀ0.004000 low, the crypto corrected upward and retested the Ƀ0.004800 high. Nevertheless, the altcoin has been on a downward move after the recent high.
LTC/USD Market
Key Levels:
Resistance Levels: $80, $100, $120
Support Levels: $50, $40, $20

Litecoin bulls have made three failed attempts to break the $90 overhead resistance. In the last retest, the coin fell to $77 low and corrected upward. Today, LTC is falling after retesting the $86 high. On December 8, the bears broke the previous low at $78, retested it, and resumed the downward move. It appears sellers are poised to retest the previous low at $64.5.
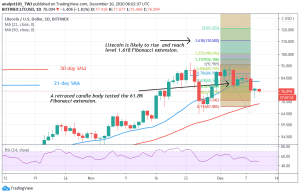
Nonetheless, if the crypto falls and finds support at $64.50, LTC is likely to resume a fresh uptrend. Meanwhile, the Fibonacci tool has indicated an upward movement of the coin. On December 2 uptrend, LTC reached a high of $92 but was resisted. The retraced candle body tested the 61.8% Fibonacci retracement level. The retracement reveals that the LTC will rise and reach level 1.618 Fibonacci extensions or the high of $110.50.
Litecoin Indicator Analysis
Litecoin is at level 48 of the Relative Strength Index period 14. It indicates that the coin is in the downtrend zone and below the centerline 50. The price bars have broken the 21-day SMA. A break below the SMAs will compel the coin to decline.
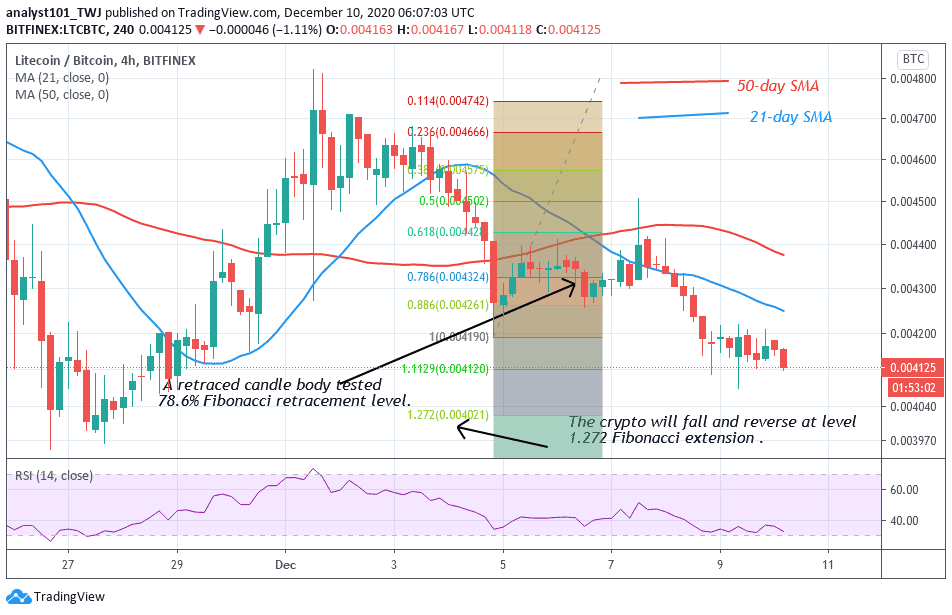
On the LTC/BTC chart, the crypto resumed the downward move after retesting the Ƀ0.004800 high. Sellers pushed the crypto to Ƀ0.004200 low and it made another retest at the Ƀ0.004500 high. The altcoin has continued the downward move. The Fibonacci tool has indicated a further downward movement of the coin and possible reversal. On December 4 downtrend; a retraced candle body tested the 78.6% Fibonacci retracement level. The retracement gives the impression that the LTC/BTC will fall and reverse at level 1.272 Fibonacci extension or the low of Ƀ0.004021.
Join Our Telegram channel to stay up to date on breaking news coverage