Join Our Telegram channel to stay up to date on breaking news coverage
Lucky Block: August 18th
The LBLOCK/USD market is already showing indications of value correcting in the upward direction. Furthermore, this will be opening up new trading chances for traders in this market. Traders should enter this market without delay, as Lucky Block is prepared to reward buyers over sellers.
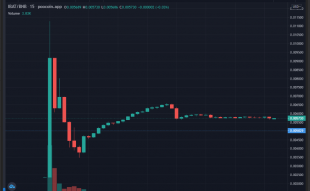
Current Value of LBLOCK’S: $0.002018
LBLOCK Market Cap: $7.9 million
LBLOCK Systemic Supply: ——
LBLOCK Overall Supply: 3.6 billion
LBLOCK Coinmarketcap Position: #3350
Key Price Marks:
Resistance: $0.002018, $0.002087, $0.002298
Support: $0.002120, $0.002085, $0.002009
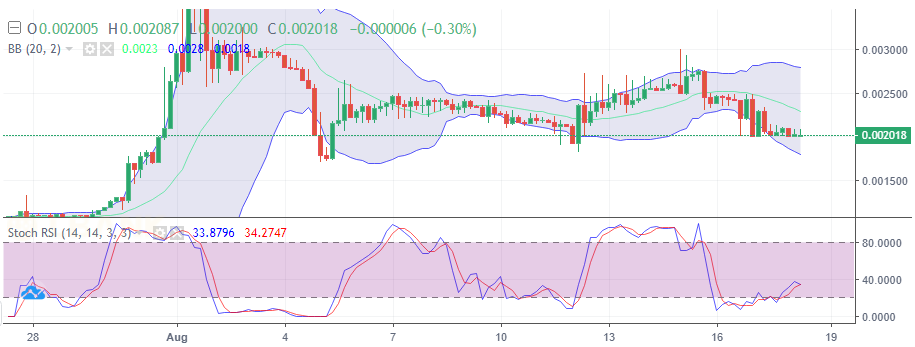
Lucky Blocks Price Analysis: LBLOCK/USD Value Currently Bouncing off the Lower Band of the Bolinger Indicator
The LBLOCK/USD 4- hour chart reveals what is likely to happen to price movement very soon. Examining this chart, we’ll see that there are two bullish inverted hammer candlesticks. Consequently, the appearance of these candles indicates a bullish value correction. Combined with the fact that price action is currently being rejected at the lower band of the Bollinger indicator, this implies that the value may rise very high. Eventually, this may result in Lucky Block reaching higher value level of $0.002350 and above. Traders may set up a Buy stop for this market, to buy once the upward correction is actualized.
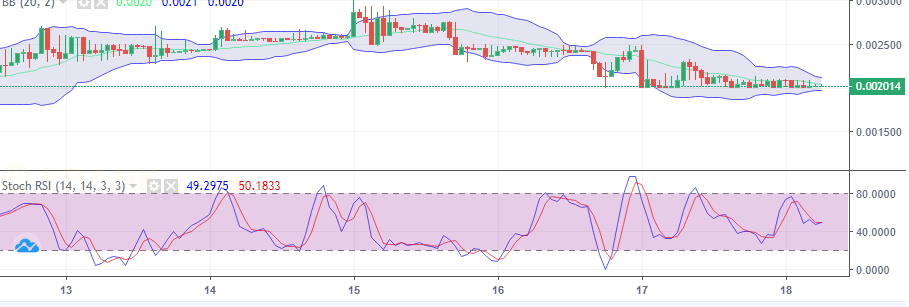
Lucky Blocks Price Analysis: LBLOCK/USD Upward Correction Stays Positive
LBLOCK/USD hourly chart reveals that the mentioned upward correction is very close by. At this point, we can perceive that the Bollinger indicator is getting narrower. The rule behind this Indicator is that once a narrowing occurs price will experience either a strong bullish or bearish move afterward. However, going by the most recent candle formation on this chart, the resulting move will most be bullish. Finally, the Stochastic RSI also attempts an upward cross, this is hinting that the developing trend is already gathering strength.
You can purchase Lucky Block here. Buy LBlock
Related
Join Our Telegram channel to stay up to date on breaking news coverage