Join Our Telegram channel to stay up to date on breaking news coverage
The Kyber Network price prediction reveals that KNC is moving with an uptrend, and traders could expect an early arrival of a price rally.
Kyber Network Prediction Statistics Data:
- Kyber Network price now – $0.68
- Kyber Network market cap – $116.9 million
- Kyber Network circulating supply – 170.5 million
- Kyber Network total supply – 228.5 million
- Kyber Network Coinmarketcap ranking – #175
KNC/USD Market
Key Levels:
Resistance levels: $0.80, $0.82, $0.84
Support levels: $0.52, $0.50, $0.48

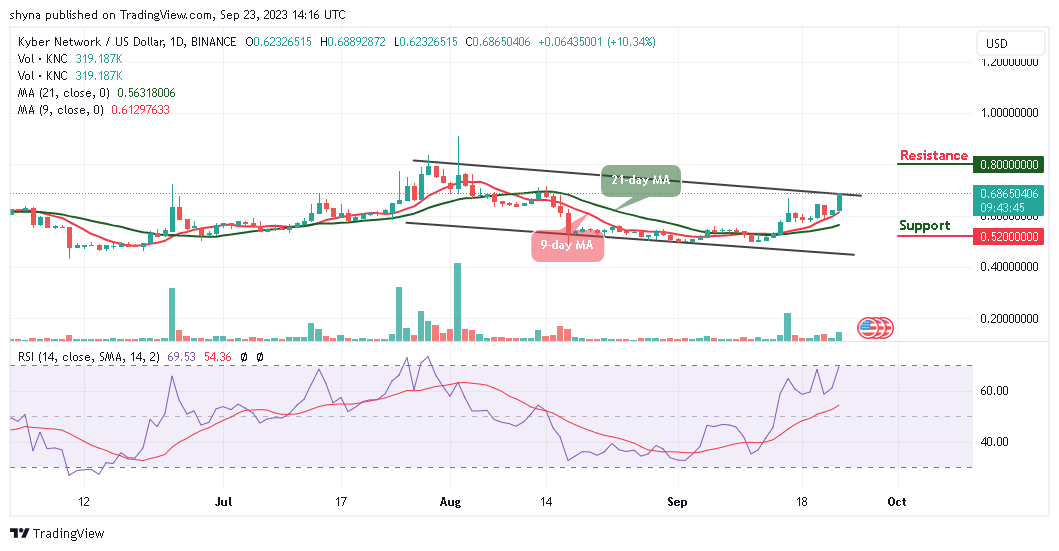
KNC/USD is currently experiencing an upward trajectory, with the coin maintaining its position above the 9-day and 21-day moving averages. Despite market pressure, the Kyber Network price has shown a consistent inclination to rise. Notably, the crypto market is making significant progress toward the upper boundary of the channel.
Kyber Network Price Prediction: Potential Upside for KNC
As of the present moment, the Kyber Network price stands firm at $0.68. If it tests the $0.62 support level, there is a likelihood of a downside break. Should KNC/USD breach this level, traders should anticipate further downward movement, with key support levels at $0.52, $0.50, and $0.48 potentially coming into play.
Taking a closer look at the daily chart, the Kyber Network price hovers around $0.68, driven by a robust bullish trend supported by modestly positive technical indicators. However, resistance points at $0.80, $0.82, and $0.84 are worth noting if the bulls increase the pressure. Furthermore, the Relative Strength Index (14) indicates an overbought condition, suggesting the potential for increased bullish momentum.
KNC/BTC Aims for Upside
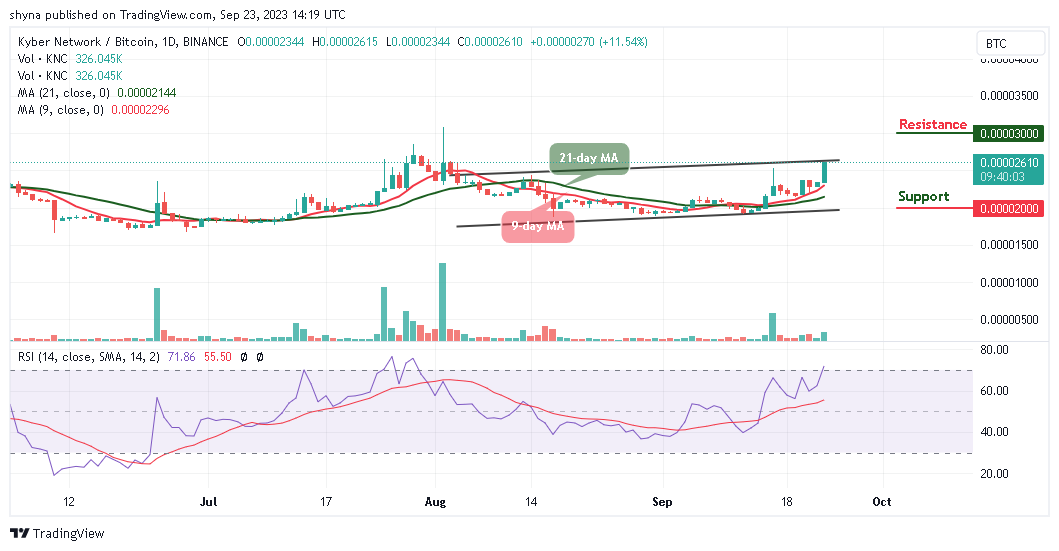
In the context of KNC/BTC, the Kyber Network price is also on an upward trajectory, with market values moving to break above the upper boundary of the channel and reaching a daily high of 2615 SAT. Meanwhile, KNC/BTC is currently confined within the trading channel, with traders anticipating further bullish momentum. The Relative Strength Index (14) for this pair is moving within the overbought region.

Additionally, if the bulls manage to maintain the price above the 9-day and 21-day moving averages, traders may encounter initial resistance at 2800 SAT. Beyond this point, a stronger resistance level can be identified at 3000 SAT and above. Conversely, should sellers bring the market below the lower boundary of the channel, it could experience a significant support level at 2000 SAT and below.
Alternatives to Kyber Network
The Kyber Network price is in the hands of the bulls as the coin trades above the 9-day and 21-day moving averages. However, due to the current bullish movement, the coin may soon cross above the upper boundary of the channel. The technical indicator Relative Strength Index (14) is moving to cross into the overbought region with the signal line pointing to the north for more bullish signals.
In the meantime, an intriguing development on the horizon is the imminent official launch of Wall Street Memes, scheduled for the next few days. This presents an enticing opportunity for investors to capitalize on. The token has rapidly risen to prominence, making it one of the standout crypto sensations of the year. With a substantial and dedicated following, $WSM has remarkably gathered over $25 million during its presale phase, setting the stage for an impressive debut on several renowned exchanges shortly.
CoinCodex - Our Recommended Crypto Research Platform
- Live Cryptocurrency Prices for Over 20,000 Coins
- Crypto Price Analysis with Popular Technical Indicators
- Crypto Price Predictions with Short and Long-Term Charts
- Historical Crypto Market Data Dating to 2010
- Crypto Portfolio, Profit Calculator, and Other Investment Tools
Join Our Telegram channel to stay up to date on breaking news coverage


