Join Our Telegram channel to stay up to date on breaking news coverage
The Kyber Network price prediction shows that KNC may cross above the channel to hit the $1.0 resistance level.
Kyber Network Prediction Statistics Data:
- Kyber Network price now – $0.90
- Kyber Network market cap – $149 million
- Kyber Network circulating supply – 164.8 billion
- Kyber Network total supply – 223.3 million
- Kyber Network Coinmarketcap ranking – #180
KNC/USD/USD Market
Key Levels:
Resistance levels: $1.10, $1.20, $1.30
Support levels: $0.65, $0.55, $0.45
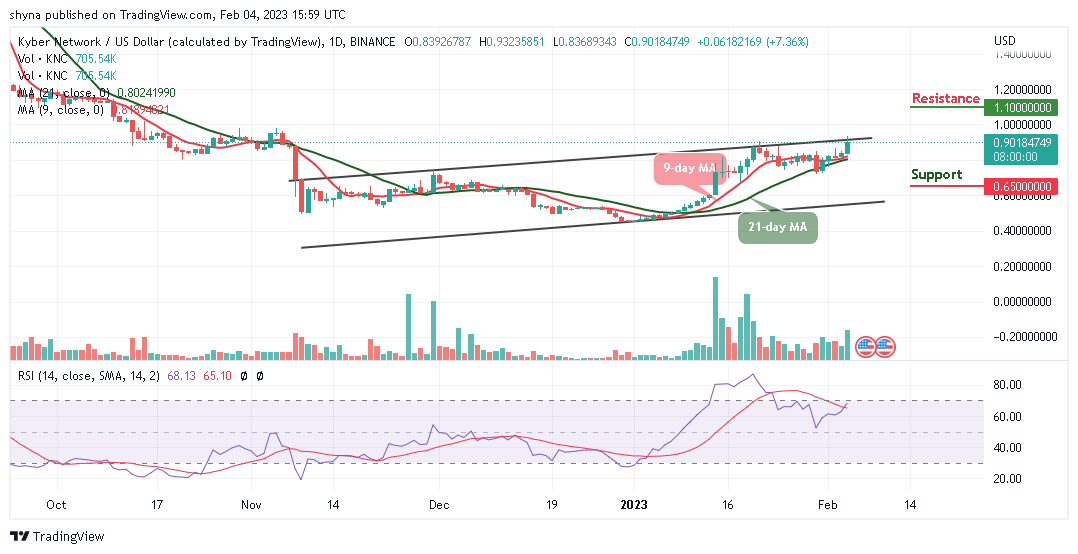
KNC/USD bulls are trying to push the coin above the upper boundary of the channel as the technical indicator Relative Strength Index (14) reveals that the market may embark on a positive movement as the signal line moves to cross above into the overbought region.
Kyber Network Price Prediction: KNC Price May Follow the Uptrend
The Kyber Network price is changing hands at $0.90 where it faces up. If the coin breaks above the channel, the coin may begin the upward movement. However, any further bullish movement may locate the nearest resistance levels at $1.10, $1.20, and $1.30, while falling below the 9-day and 21-day moving averages and sliding toward the lower boundary of the channel could reach the support levels of $0.65, $0.55, and $0.45 respectively with a long bullish trading volume.
Against Bitcoin, the Kyber Network price is moving above the 9-day and 21-day moving averages as the bulls head to the positive side. On the downside, if the market price fall and drops towards the lower boundary of the channel, the next support level may surface at 3500 SAT to locate further key support at 3000 SAT and below if the sell-off later becomes huge.
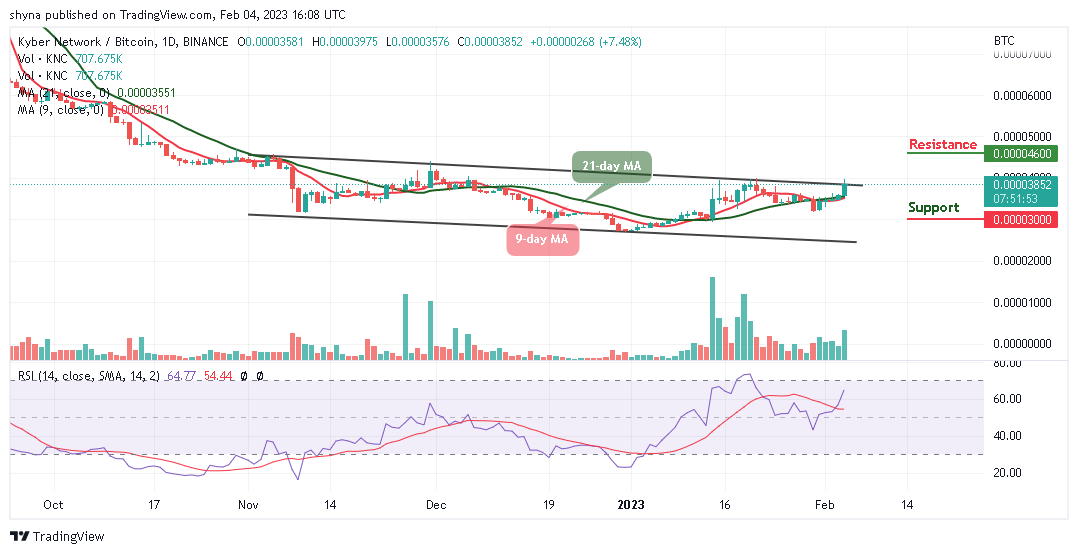
On the upside, if the bulls push the price above the upper boundary of the channel; further bullish movement may hit the potential resistance level at 4600 SAT and above while the signal line of the Relative Strength Index (14) moves above the 60-level to continue the bullish movement. On the other hand, if it moves below this level, sellers may resume back and this could bring bearish pressure into the market.
Kyber Network Alternatives
The Kyber Network (KNC) is trading in the green today and is on a two-day streak of positive price form on the daily chart. The coin is trading above the 9-day and 21-day moving averages, showing bullish pressure in the market. Nevertheless, there is another token in the market with a high rate of positive returns – Meta Masters Guild (MEMAG) tokens are selling quickly as the over $2.7 million presale has been raised so far, the investors now have less than three days to secure MEMAG tokens before the increase in price.
Read more:
Join Our Telegram channel to stay up to date on breaking news coverage