Join Our Telegram channel to stay up to date on breaking news coverage
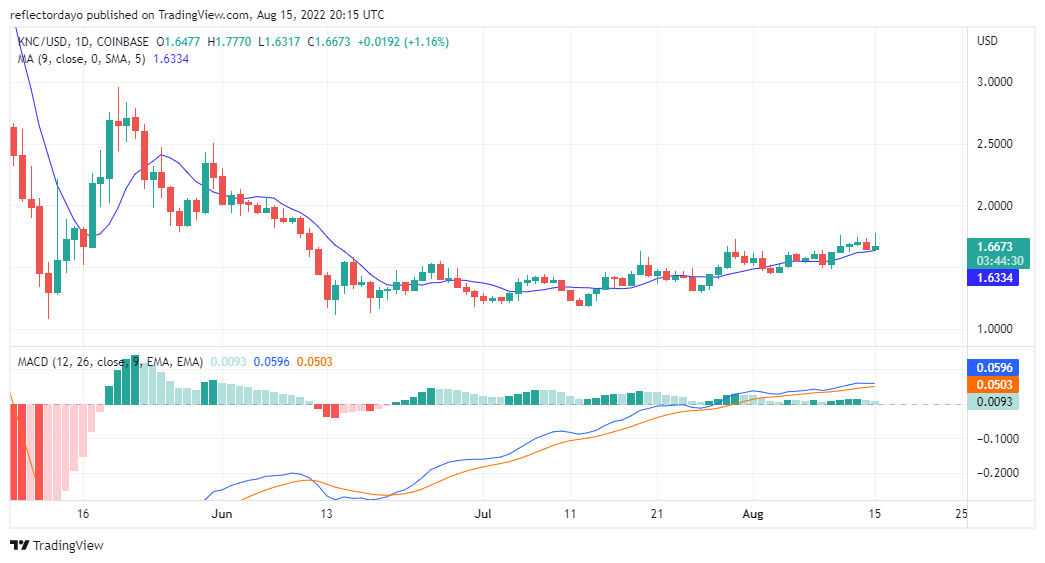
Yesterday the selling pressure was considerably high which resulted in a very bearish market. Today, sellers open the session with very high expectations. The buying pressure appear to have suspended the market’s bearishness. Today’s bullish activities may trigger an uptrend as it appears that bulls are taking over. For now, the price holds at $1.6588. The 9-day moving average is moving through the erratic activities of the price of KNC/USD. this indicate serious contest between demand and supply.
Kyber price Data
- KNC/USD price now: – $1.6986
- KNC/USD market cap: – $171 million
- KNC/USD circulating supply: – $178 million
- KNC/USD total supply:- 56,382,240 Kyber
- KNC/USD coin market ranking: – #201
Key levels
- Resistance:-$1.5324, $1.6432, $1.6986
- Support:- $1.5139, $1.4493, $1.3015
Your capital is at risk
Kyber May Soon Pop Out of The $1.6986 Resistance Level
Today’s market performance may spark another bullish trend as bears could not sustain their victory. The buying pressure is high as the price is pushed up to its current $1.6986 level. There is a possibility of KNC/USD change of direction to favour the bulls.
The Indicators Point of View of The Market Behaviour
The MACD line is losing momentum and the signal line is almost catching up. This is resulting in decreasing histogram activities. At the time of writing, histogram activities measure a difference of 90. The Relative Strength Index shows a strength of 58.26%, while the signal line measures 56.44%. RSI Reveals that market strength has improved in comparison to yesterday’s performance.

Price Prediction KNC/USD 4-Hour Chart Outlook
The first 4-hour trading session was bullish, and then selling pressure reduced the momentum. The third and fourth trading session was a serious tug-of-war between the bulls and the bears. KNC/USD price may continue trending up steadily.
Related
Join Our Telegram channel to stay up to date on breaking news coverage