
Join Our Telegram channel to stay up to date on breaking news coverage
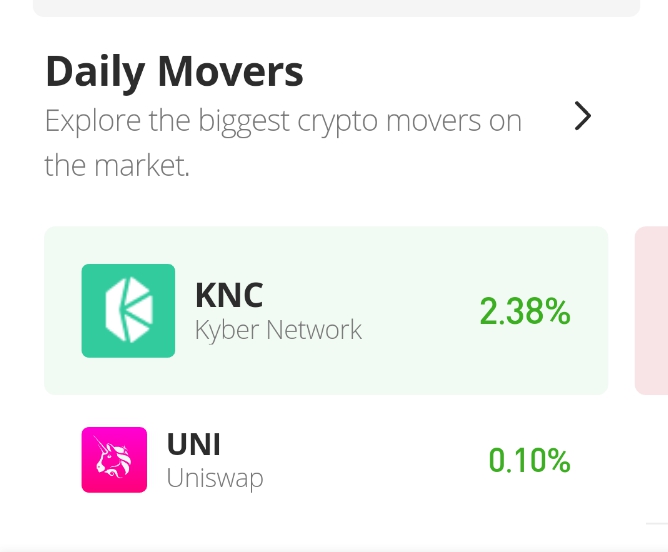
Kyber has recorded some movement today. Although it could be described as a very minimal movement, it was enough to see this crypto top the daily mover list. What else can be expected of this crypto? How further up will it rise in value? Or will this trend reverse? This and more of these questions will be examined shortly.
Kyber Current Price: $1.4805
Kyber Market Cap: $250.6 million
Kyber Total Supply: 177.8 million
Kyber Rank: 109
Major Levels:
Ceiling Level: $0.5194, $0.6110, $0.6294
Floor Level: $0.6000, $0.5610, $0.5500
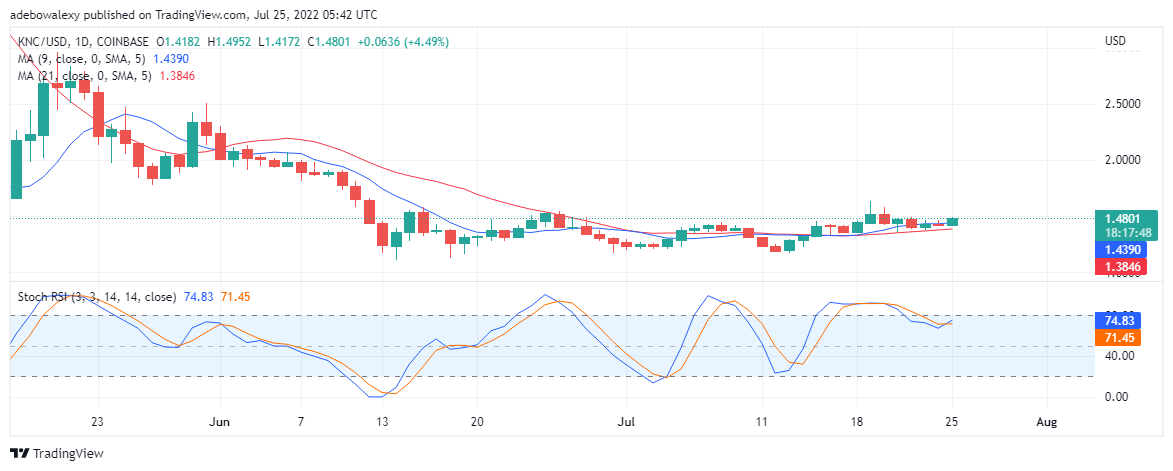
KNC/USD Value Prediction: Kyber’s Steady Upside Gain
The KNC/USD daily trading chart shows that this crypto may be at the early stage of a steady upside gain. On this chart, the price activity is in contact with the faster moving average curve, while the slower one stays considerably below it. Also, a bullish candlestick formed recently portrays the recorded movement in this market. Consequently, this has brought Kyber to value at $1.4801.
Furthermore, the Stochastic Relative Strength Indicator (SRSI), reveals that value may be at the start of a steady up rise in value. This inference can be drawn from that the indicator curved crossed each other, in an upward bending form at the 74% and 71% levels. This activity tells of a gradually rising price of this crypto. At this stage, UNI/USD value could reach $1.7000 very soon.
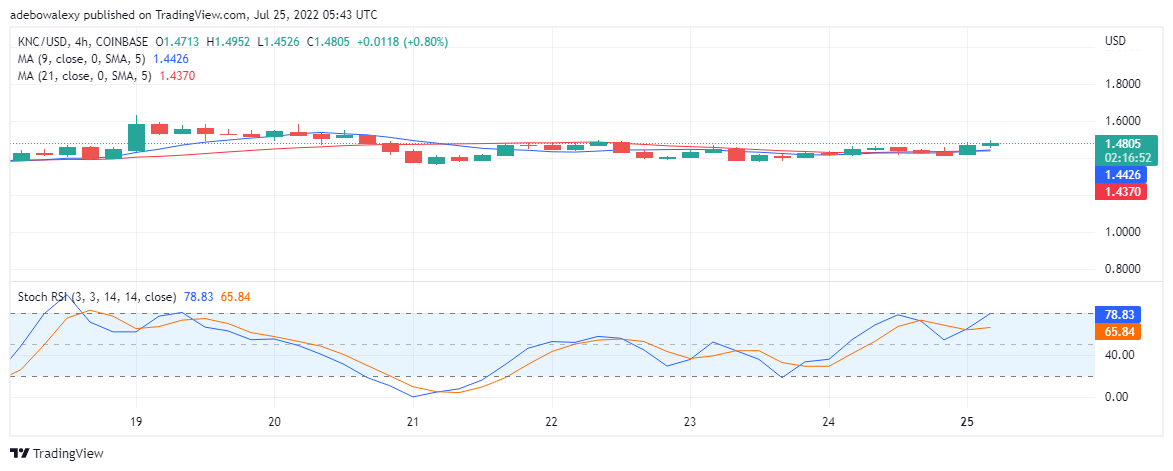
KNC/USD Value Prediction: Kyber’s Upside Trend is Steadily Gaining Strength
KNC/USD 4-hour chart, we can see that a bullish candle has formed above the terminal of the crossed MA lines. This is telling us that the uptrend is steadily building up. Furthermore, the MA curves have crossed below the value motion which is sure to supply some thrust to the value movement.
Also, the SRSI indicator reading aligns that things are being kept steady. In addition, it seems that a trend reversal may not occur very soon, looking at the divergence between the crossed SRSI lines. Consequently, this may give more time for value to rise further and more time for traders to utilize this trend.
Join Our Telegram channel to stay up to date on breaking news coverage