Join Our Telegram channel to stay up to date on breaking news coverage
Kaspa’s market performance suggests potential growth as it attempts to rebound from a recent drop. KAS is currently trading at $0.187578, representing a 1.38% increase.
Kaspa Key Statistics:
- Current Price: $0.187578
- Market Cap: $4.51 billion
- Circulating Supply: 24.35 billion KAS
- Total Supply: 24.36 billion KAS
- CoinMarketCap Ranking: 22
KAS/USDT Market
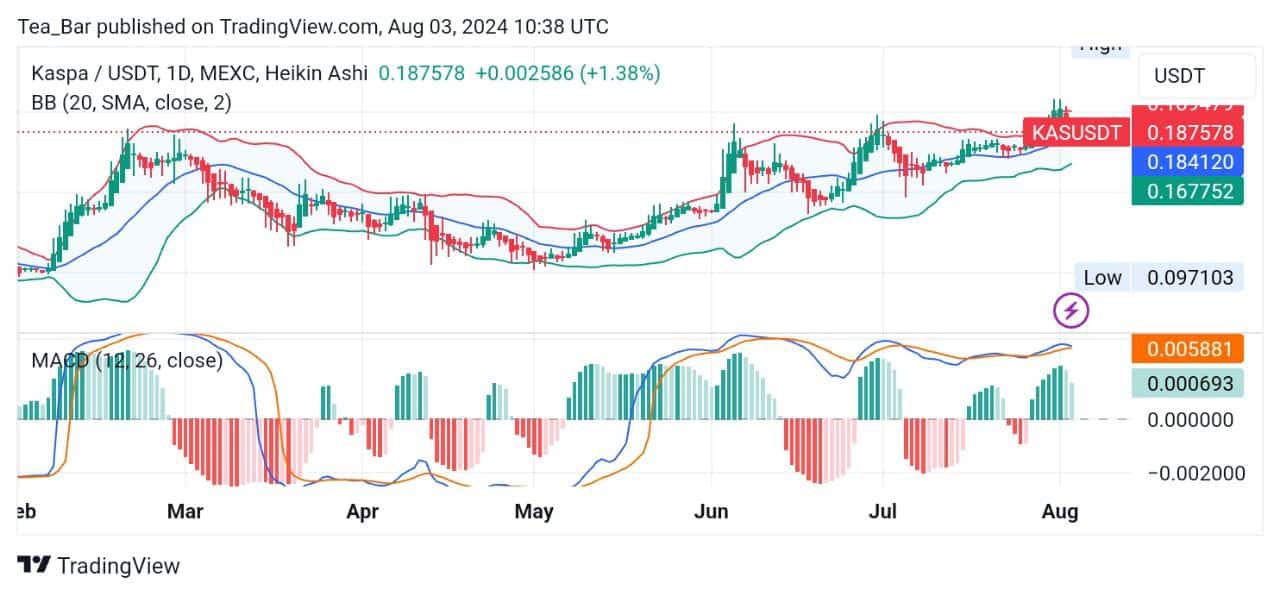
Kaspa has shown a recent upward trend with periods of consolidation. With a current trading volume of $126.34 million, involving 653,411,818 KAS. Its market engagement is moderate. Over the last 30 and 7 days, Kaspa’s price has decreased by 8.71% from its peak, but surged by 28.63% and 7.54% from the minimum prices, respectively.
Key Resistance and Support Levels:
- Resistance Levels: $0.1900, $0.2000, $0.2100
- Support Levels: $0.1670, $0.1570, $0.1470
A detailed analysis of the daily chart reveals that Kaspa’s upper Bollinger Band is at $0.1914, the middle band at $0.184120, and the lower band at $0.167752. Kaspa’s price movement shows a pattern of higher highs and higher lows, suggesting continued bullish momentum.

Can Kaspa Break Through $0.20 Resistance?
Kaspa’s price trend has displayed a bullish bias with recent upward movement. The immediate resistance level is around $0.1950, with potential upward movement toward $0.20 if this level is breached. However, concerns about the rally’s sustainability persist due to the presence of lower highs in the past. To overcome this, sustained buying pressure is essential to drive the price towards the resistance levels.
The MACD indicator shows a bullish crossover, suggesting strengthening bullish momentum. However, the histogram is starting to shrink, indicating potential exhaustion of the current uptrend.
KAS/BTC Performance Insights
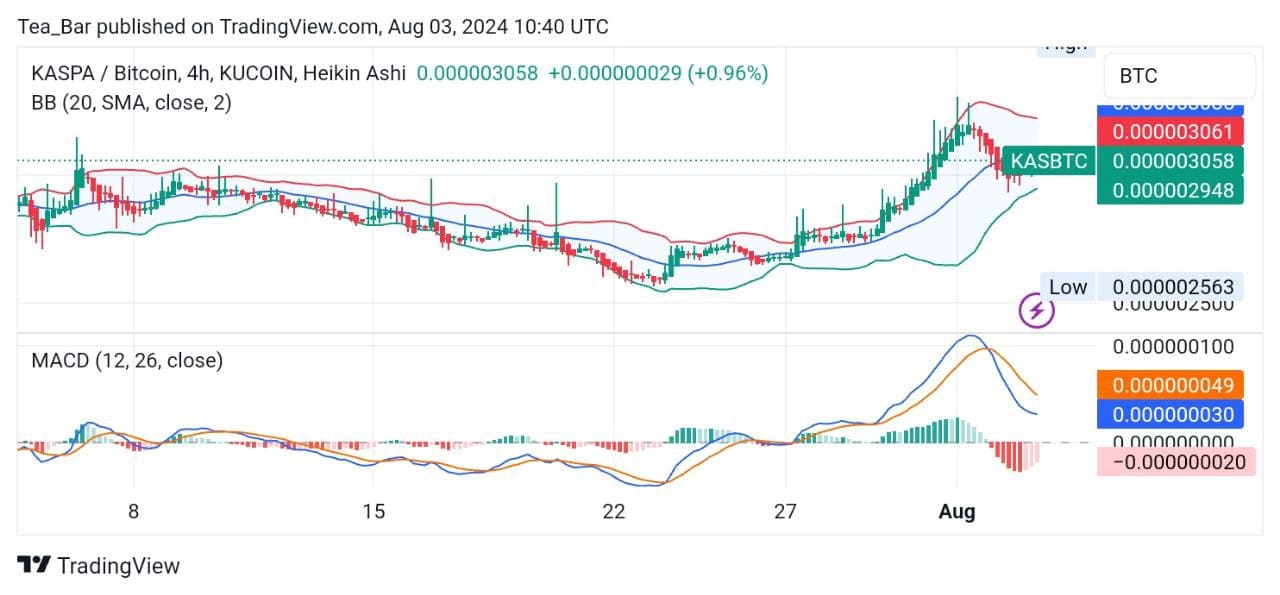
The KAS/BTC pair is exhibiting a bullish trend, with the price trading above the 20-period Simple Moving Average (SMA). The overall chart structure suggests a potential uptrend, punctuated by periods of consolidation. Key indicators reinforce this bullish sentiment.

The price has formed higher highs and higher lows, a classic bullish pattern. The Bollinger Bands are expanding, indicating increasing volatility, while the price’s interaction with the upper band suggests potential for either a breakout or a pullback. The MACD, with its positive and increasing histogram and the MACD line above the signal line, confirms the growing bullish momentum.
Additionally, @plzsats mentioned on X (formerly Twitter) that a respected developer from the early days of Litecoin and some top crypto researchers are involved with KAS. This suggests that the project has credible and experienced individuals behind it, which might challenge claims of it being a scam.
You know one of the og litecoin devs and some of the best crypto researchers in the business is working on kaspa right?
call it a scam if you want, but your gonna keep on questioning yourself why it’s not going away in the coming years pic.twitter.com/glgPoKXTOO
— Captain Sats 𐤊 (@plzsats) August 2, 2024
Where to Trade Kaspa – Margex
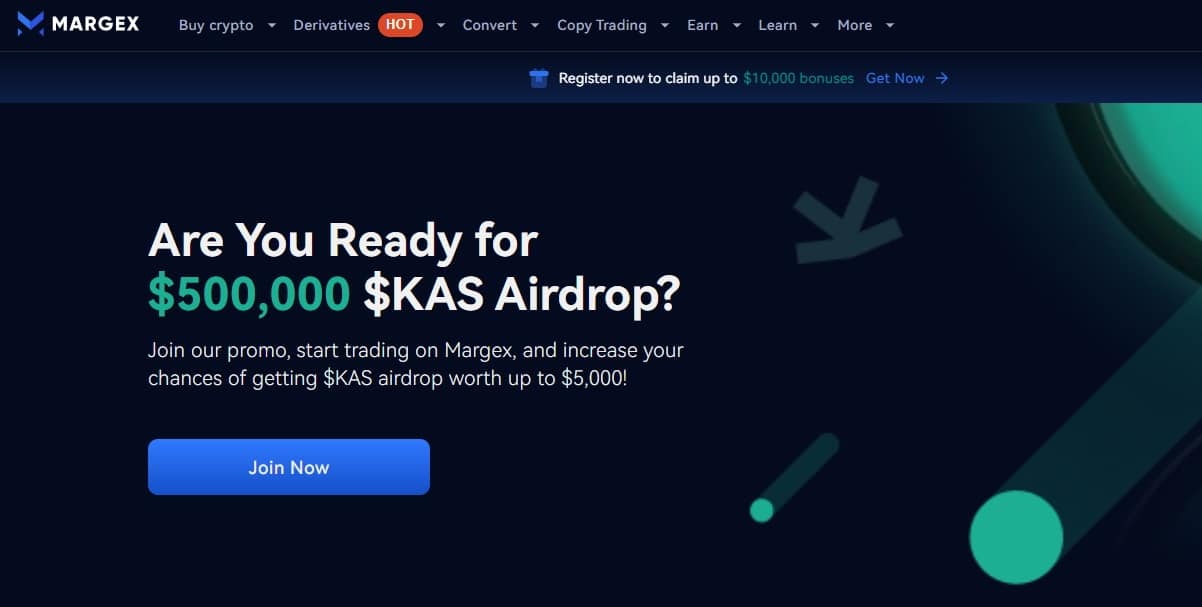
We rate popular crypto exchange Margex the top place to trade KAS, and also take part in promotions such as $KAS airdrop campaigns which run occasionally, alongside other token airdrops.

A recent 2024 Kaspa airdrop promotion on Margex
Related News
- Kaspa Price Prediction: KAS Tops Gainers As Crypto Market Plunges, While This PEPE 2.0 ICO Is Still Going Like Gangbusters
- Data Reveals US Government Is A Shiba Inu Whale As SHIB Rival PlayDoge Closes On $6 Million In Presale
Join Our Telegram channel to stay up to date on breaking news coverage


