Join Our Telegram channel to stay up to date on breaking news coverage
According to the daily chart, the IOTA price prediction shows that MIOTA is likely to cross above the upper boundary of the channel.
IOTA Prediction Statistics Data:
- IOTA price now – $0.206
- IOTA market cap – $570.8 million
- IOTA circulating supply – 2.7 billion
- IOTA total supply – 2.7 billion
- IOTA Coinmarketcap ranking – #71
MIOTA/USD Market
Key Levels:
Resistance levels: $0.240, $0.250, $0.260
Support levels: $0.170, $0.160, $0.150
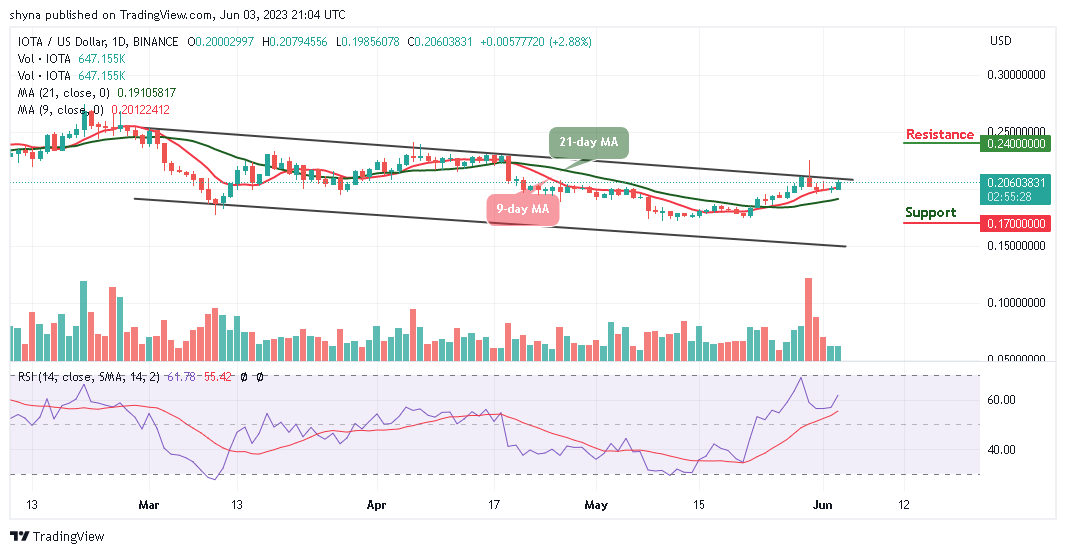
MIOTA/USD is hovering above the 9-day and 21-day moving averages at the time of writing. In the last few hours, the IOTA price begins to move upward as the coin prepares for the upside. However, the technical indicator Relative Strength Index (14) is seen hovering above the 60-level, confirming the slight bullish movement in the market.
IOTA Price Prediction: MIOTA Price May Move to the Upside
As the daily chart reveals, the IOTA price is currently exchanging hands above the 9-day moving average, if the coin continues with the bullish movement, the bulls may head toward the upper boundary of the channel where it could hit the resistance levels of $0.240, $0.250, and $0.260.
On the contrary, if the coin slides below the 21-day moving average, it could return the coin to the support levels of $0.170, $0.160, and $0.150 respectively. Meanwhile, long-term buyers should not be bothered by the small impact on the road, as the future of MIOTA is assured as revealed by the technical indicator Relative Strength Index (14).
Against Bitcoin, the IOTA price is hovering above the 9-day and 21-day moving averages. The technical indicator Relative Strength index (14) is seen facing the 70-level, which increases the bullish movement. However, a possible cross above the upper boundary of the channel may cause the coin to hit the resistance level of 850 SAT and above.
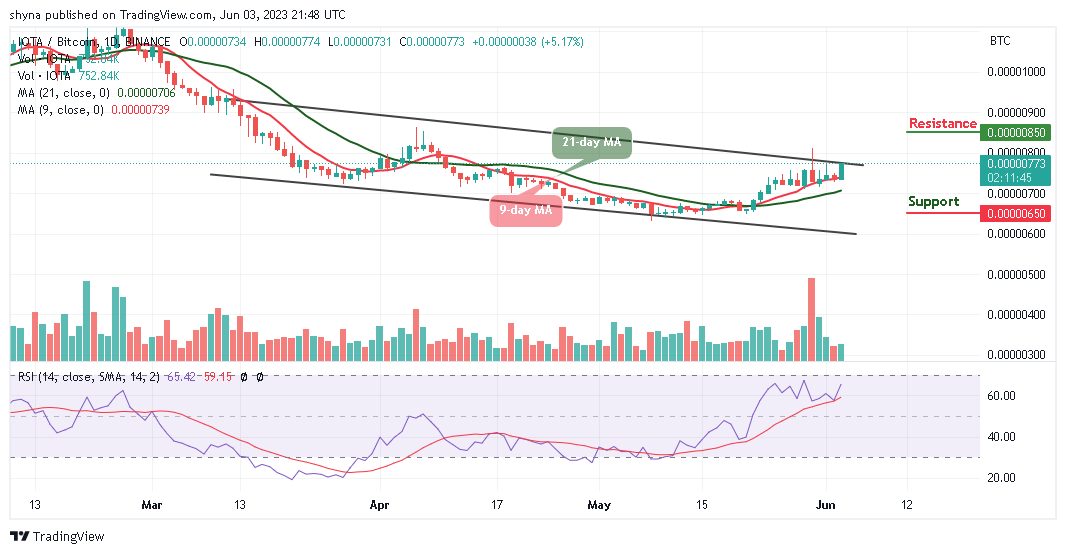
Meanwhile, any bearish movement toward the south could bring the coin to the support level of 650 SAT and below, but breaking to the upside may take it to a new high.
IOTA Alternatives
The IOTA price is hovering above the 9-day and 21-day moving averages at the time of writing. However, the technical indicator Relative Strength Index (14) is seen hovering above the 60-level, confirming the slight bullish movement in the market. On that note, the presale is split into 30 stages, each with its own price point. By taking this approach, Wall Street Memes team aims to reward those who show early faith in the project. The response to the presale has been immense – with almost $3 million in funding raised so far.
Read more:
- Ripple Price Prediction: XRP/USD Stays Below $0.60; Recovery May Take Time
- Ethereum Price Prediction: ETH/USD continues the flat movement, Uncertain of uptrend move
New OKX Listing - Wall Street Memes

- Established Community of Stocks & Crypto Traders
- Featured on Cointelegraph, CoinMarketCap, Yahoo Finance
- Rated Best Crypto to Buy Now In Meme Coin Sector
- Team Behind OpenSea NFT Collection - Wall St Bulls
- Tweets Replied to by Elon Musk
Join Our Telegram channel to stay up to date on breaking news coverage