Join Our Telegram channel to stay up to date on breaking news coverage
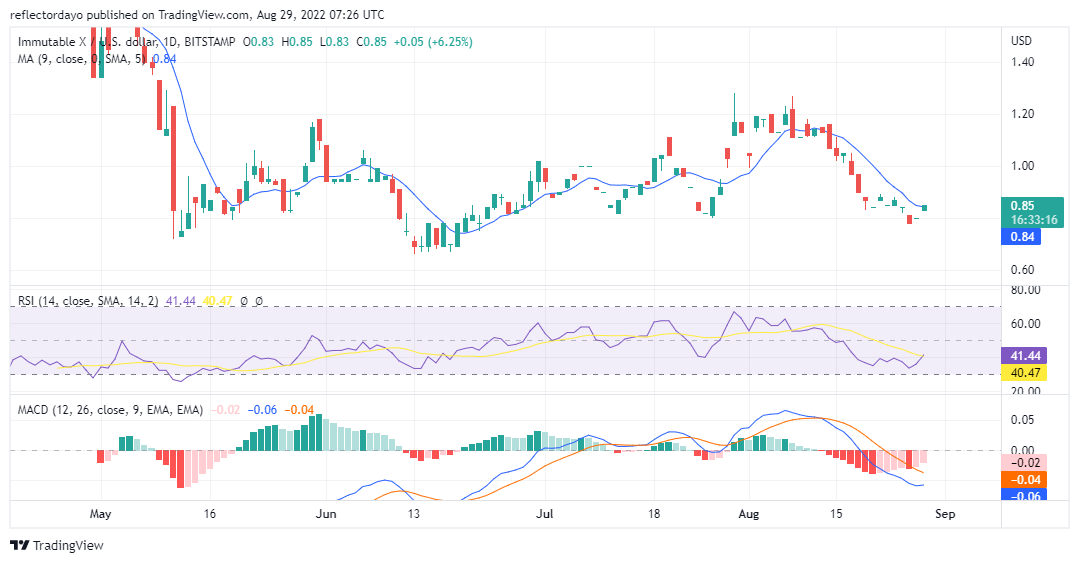
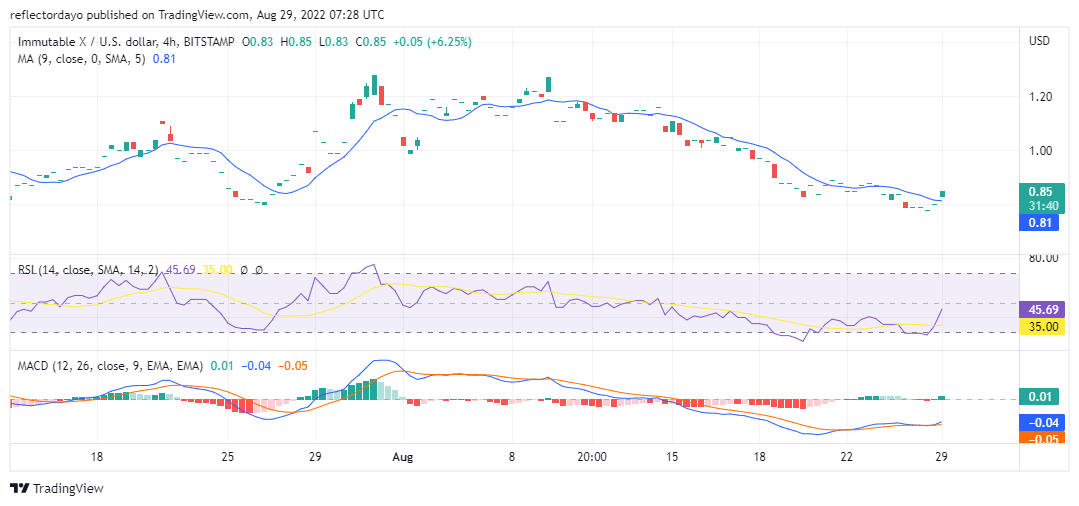
IMX/USD market chart is dotted with some ‘4 price’ dojis. A 4-price doji is a kind of candlestick where all 4 indications of a candlestick are of the same value. The open, the close, the high and the low are all just equal. It is like the buyers and sellers are showing a lack of interest. Following a very bearish market on the 27th of August, buyers bid a high price on the 28th of August. The price was higher than the bearish closing price of the 27th of August. That was the reason why there was a space between the closing price and of opening price on the 27th and 28th. This bullish move appears impressive. However, the price did not progress from that position till the day ended. But in Today’s market, buyers are pushing the market, from the downside, through the 9-day moving.
Immutable X Price Statistic:
- IMX/USD price now: $0.8387
- IMX/USD market cap: $196,601,437
- IMX/USD circulating supply: 235,284,001.00
- IMX/USD total supply: 2,000,000,000
- IMX/USD coin market ranking: #133
Key Levels
- Resistance: $0.90000, $0.970000, $1.020000
- Support: $0.80000, $0.780000, $0.0.690000
Your capital is at risk
Immutable X Price Analysis: Dynamic Market
The market is not mostly unresponsive, Some trading sessions were bearish, and some trading sessions were bullish. On the 26th of August, the buyers recovered the bearish price but they closed the market at exactly the point where the bears open the market that day. This would have given us the impression that the following day will be bullish. But against expectations, the following day was bearish.
Immutable X Price Analysis: The Indicators Point of View
In the RSI, the fast line has crossed the slower line with a difference of 1% on the downside of the indicator. This signifies that the trend is about to change. In confirmation of this intended trend swing, the MACD line is retracing an upper direction towards the signal line. And the histograms have turned to pink to signify recovery.
Immutable X Price Analysis: IMX/USD 4-Hour Chart Outlook
This timeframe shows that most of the sessions were filled with unresponsiveness. Tracing the market activities from the 16th of August, we can see that most of the trading sessions were one-sided. Some sessions are bullish, some are bearish and some are unresponsive.
Related
Join Our Telegram channel to stay up to date on breaking news coverage
