


Join Our Telegram channel to stay up to date on breaking news coverage
The bears’ momentum is increasing in HOT market
HOTUSD Price Analysis – September 16
Further increase in the bears’ momentum will make the price to break down the support level of $0.0020; below it are $0.0018 and $0.0016 support levels. Should the $0.0020 support level holds, HOT may reverse and face the resistance level at $0.0021, $0.0023 and $0.0025.
Key levels:
Resistance levels: $0.0021, $0.0023, $0.0025
Support levels: $0.0020, $0.0018, $0.0016
HOTUSD Long-term Trend: Bearish
HOTUSD is bearish on the daily chart. The price obeyed the bullish command when bullish engulfing candle emerged at the support level of $0.0020 on July 28. The bulls took over the market when the price reached the low of $0.0020 price level. The price increase towards the resistance level of $0.0028. The bulls could not break up the level. The bears took over with the formation of bearish engulfing candles. Price decrease to the support level of $0.0022 and starts a ranging market.
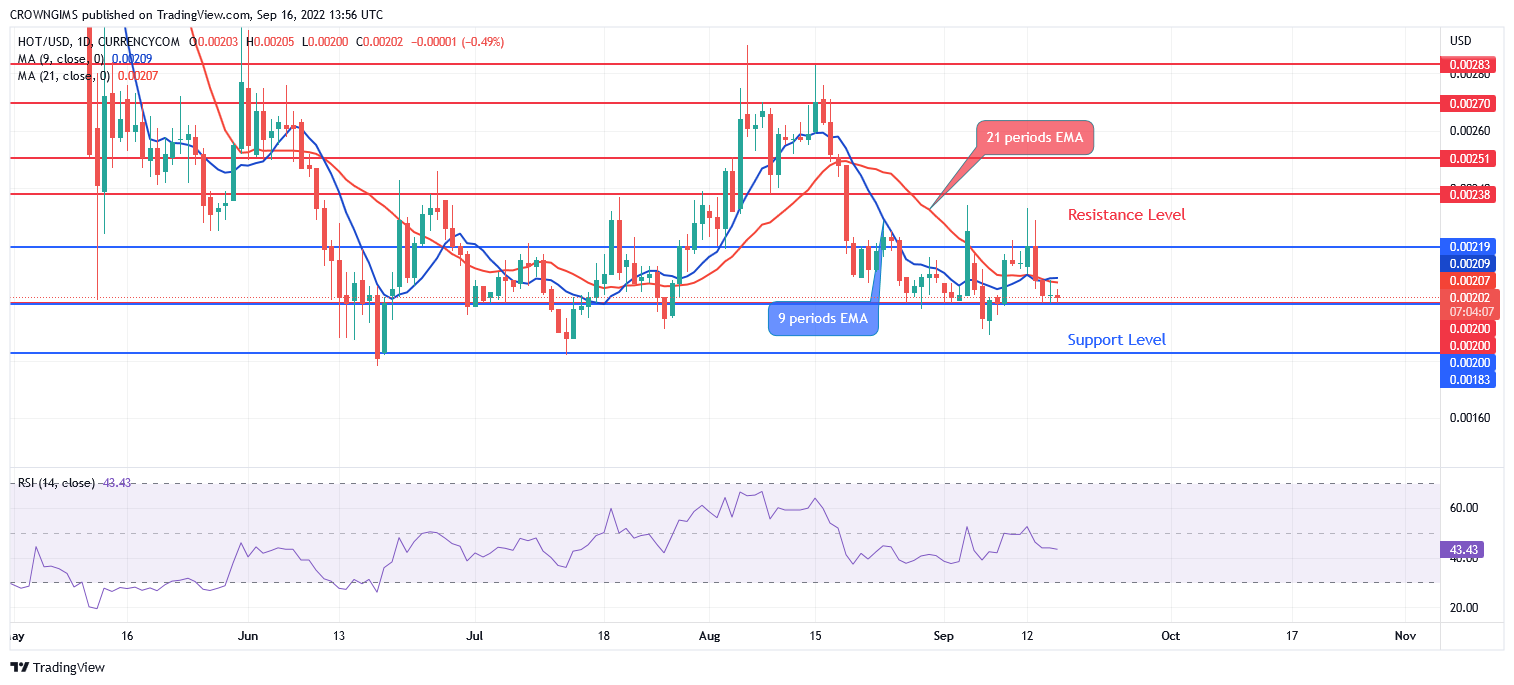
The fast Moving Average (9 periods) has crossed the slow Moving Average (21 periods EMA) downside and the price is trading below the two EMAs as a sign of bearish movement. Further increase in the bears’ momentum will make the price to break down the support level of $0.0020; below it are $0.0018 and $0.0016 support levels. Should the $0.0020 support level holds, the price may reverse and face the resistance level at $0.0021, $0.0023 and $0.0025. The relative strength index period 14 is pointing down at 42 levels to indicate a sell signal.
Your capital is at risk
HOTUSD medium-term Trend: Bearish, Tamadoge Presale Hits $16 Million
HOTUSD is bearish in the 4-hour chart. The price action on 4-hour chart formed a double top chart pattern at $0.0028 level. The price falls from the high of $0.0028 to the support level of $0.0020. The price is struggling to break down the just mentioned level.
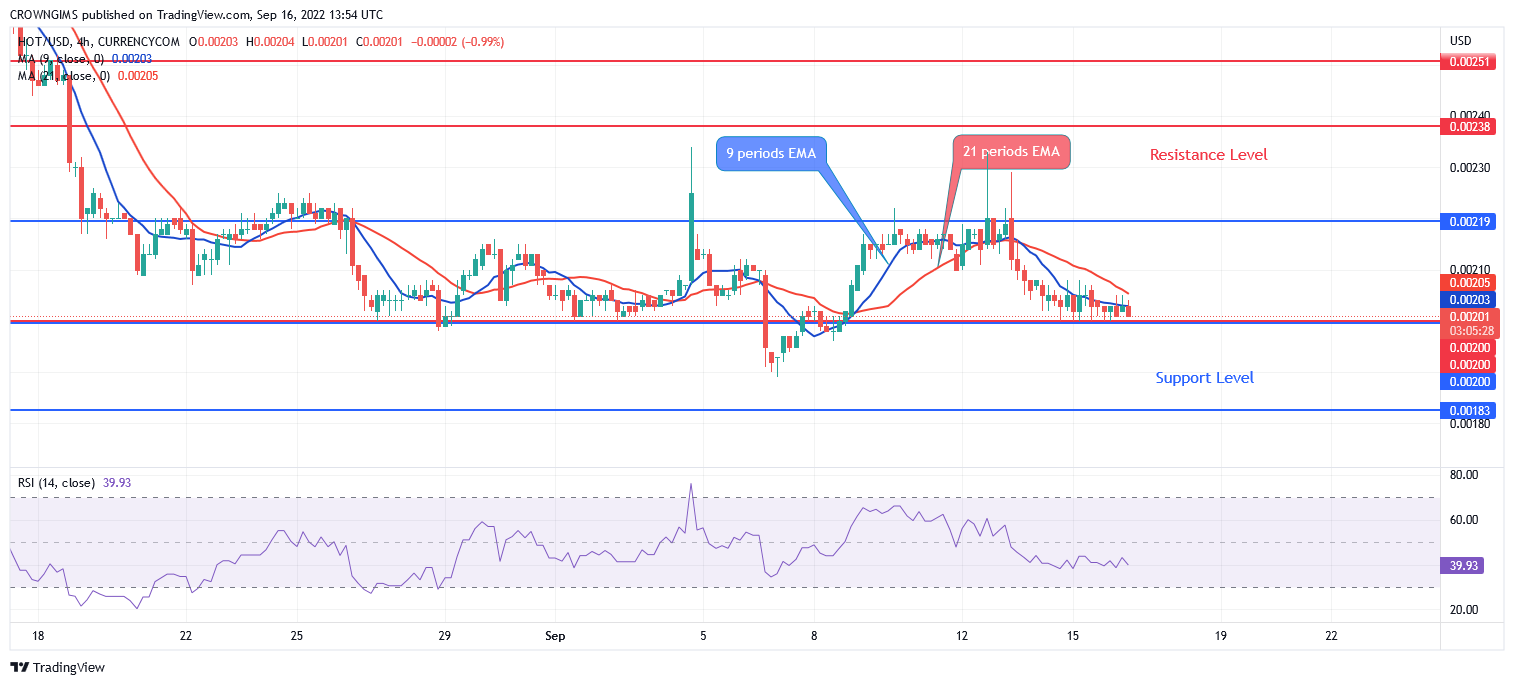
The currency has crossed over the 9 periods EMA and 21periods EMA downside and the former EMA is below the later EMA which indicates that the bears are in control of the market. The relative strength index period 14 is at 25 levels and the signal lines pointing down to indicate sell signal.
During the TAMA presale, 1 billion tokens will be sold. This number equates to 50% of the entire TAMA supply. The solid tokenomics of TAMA is one of the reasons why the presale has become very popular. Unlike other memecoins with trillions and quadrillions of coins in supply, TAMA’s supply is capped at 2 billion. TAMA has also been securing new partnerships that make the memecoin popular in the crypto community. To make it easier for traders to invest in the memecoin, the Tamadoge team has announced Fiat On-Ramp support allowing users to buy Ether with a card or using local payment methods such as Transak and then convert the ETH into TAMA.
Related
Join Our Telegram channel to stay up to date on breaking news coverage